Volume 26, Number 4, December 2000

TABLES![]()
| Table 1. Percentage of survey respondents with selected characteristics, or mean value of selected measures, by timing of survey and Apwe Plezi listenership category, St. Lucia | |||||
| Characteristic | Timing | Listenership | |||
| Pretest | Posttest | Non-listener | Casual listener | Regular listener | |
| (N=753) | (N=1,238) | (N=799) | (N=288) | (N=151) | |
| Urban residence | 18 | 25* | 23 | 29 | 31* |
| <=primary school education | 45 | 42* | 46 | 29 | 45* |
| Own a radio | 96 | 92* | 90 | 95 | 95* |
| Live in town with condoms available | 91 | 80* | 78 | 86 | 83* |
| Live in town with family planning available | 83 | 70* | 68 | 74 | 73 |
| Catholic | 71 | 63* | 63 | 59 | 65 |
| Speak Creole at home | 54 | 67* | 69 | 63 | 66 |
| In union | 36 | 44* | 45 | 44 | 42 |
| Male | 48 | 49 | 54 | 44 | 33* |
| Mean parity (and standard error) | 1.6 (0.1) | 1.6 (0.1) | 1.7 (0.1) | 1.3 (0.1) | 1.9 (0.2)* |
| Listen to Radio St. Lucia often or most often | 38 | 39 | 34 | 44 | 57* |
| Mean age (and standard error) | 29.3 (0.4) | 28.7 (0.3) | 28.9 (0.3) | 27.8 (0.5) | 29.4 (0.8) |
| Listen to Radio Helen 100 often or most often | na | 65 | 63 | 69 | 66 |
| Regular or casual listener to Apwe Plezi | na | 35 | na | 100 | 100 |
| Regular listener to Apwe Plezi | na | 12 | na | 0 | 100 |
| *Difference between surveys or between listeners and nonlisteners is statistically significant at p<=.05. Note: na=not applicable. | |||||
![]()
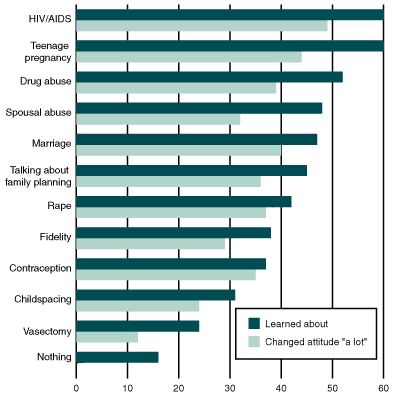
Figure 1. Percentage of regular listeners to Apwe Plezi, by self-reports of the program's effects on their knowledge and attitudes, according to theme Theme |
 |
| % |
Note: Percentages for knowledge changes reflect unprompted responses; percentages for attitude changes reflect prompted responses. |
![]()
| Table 2. Percentage of respondents, or mean value, by knowledge, attitude and behavior measures addressed by Apwe Plezi, according to timing of survey and listenership category; and multivariate results from analysis of relationship between timing of survey or listenership category and measure | |||||||
| Measure | Timing | Listenership | |||||
| Pretest | Posttest | Multivariate result | Non-listener | Casual listener | Regular listener | Multi-variate result | |
| Knowledge | |||||||
| Are aware of the pill | 77 | 83 | 1.6** | 84 | 82 | 80 | ns |
| Know that Catapult is a type of condom | na | 16 | na | 14 | 17 | 26 | 2.2** |
| Know that HIV is spread by homosexual intercourse | 90 | 93 | 1.6** | 93 | 93 | 90 | ns |
| Believe that HIV is spread by caring for AIDS patient | 24 | 37 | 1.9** | 37 | 38 | 36 | ns |
| Attitude | |||||||
| Believe it is possible to determine one's family size | 60 | 62 | 1.5** | 60 | 68 | 60 | ns |
| Mean ideal age for women's first birth (and standard error)† | 23.4 (0.2) | 22.6 (0.1) | -0.8** | 22.7 (0.2) | 22.4 (0.2) | 23.0 (0.4) | ns |
| Mean ideal number of children (and standard error)† | 2.7 (0.1) | 2.8 (0.1) | ns | 2.9 (0.1) | 2.8 (0.1) | 2.5 (0.1) | -0.4** |
| Believe men can have other sexual partners after marriage | 27 | 14 | 0.5** | 16 | 12 | 10 | ns |
| Believe women can have more than one sexual partner before marriage | 33 | 29 | ns | 30 | 33 | 19 | 0.5** |
| Believe a wife needs her husband's consent to work | 84 | 71 | 0.4** | 71 | 74 | 62 | ns |
| Believe parents should impose their will on children | 75 | 68 | 0.7** | 71 | 63 | 63 | 0.8* |
| Intend to use family planning§ | 47 | 39 | 0.7* | 37 | 46 | 35 | ns |
| Believe that you can trust staff at family planning clinics | 84 | 75 | ns | 72 | 78 | 83 | 1.5* |
| Behavior | |||||||
| Talked to spouse/partner about family planning | 77 | 67 | 0.6** | 65 | 72 | 65 | ns |
| Talked to same-sex friend about family planning | 69 | 57 | 0.6** | 52 | 69 | 57 | 1.9** |
| Talked to a family planning worker | 37 | 27 | 0.6** | 26 | 27 | 30 | ns |
| Currently use modern methodof family planning†† | 53 | 54 | ns | 55 | 58 | 47 | ns |
| Currently use condoms†† | 21 | 24 | ns | 24 | 20 | 31 | ns |
| Pregnant/partner is pregnant | 6 | 7 | ns | 7 | 7 | 6 | ns |
| Cite STD prevention as the main reason for using family planning§§ | 9 | 13 | ns | 12 | 14 | 10 | ns |
| *p<=.05. **p<=.01. †Based on respondents who gave numeric responses: 466 respondents in the pretest and 686 (429 nonlisteners, 165 casual listeners and 92 regular listeners) in the posttest. †Based on respondents who gave numeric responses: 493 respondents in the pretest and 755 (463 nonlisteners, 190 casual listeners and 102 regular listeners) in the posttest. §Based on nonusers: 380 respondents in the pretest and 661 (433 nonlisteners, 145 casual listeners and 83 regular listeners) in the posttest. ††Based on women in union: 146 respondents in the pretest and 270 (170 nonlisteners, 62 casual listeners and 38 regular listeners) in the posttest. ††Based on men in union: 120 respondents in the pretest and 277 (186 nonlisteners, 65 casual listeners and 26 regular listeners) in the posttest. §§Based on users: 318 respondents in the pretest and 542 (340 nonlisteners, 139 casual listeners and 63 regular listeners) in the posttest. Notes: Multivariate results for categorical variables are odds ratios from logistic regression and for continuous variables are coefficients from analyses of variance. na=not applicable. ns=not statistically significant. For results of multivariate analysis using other independent variables, see appendix (page 156). | |||||||
![]()
| Table 3. Volume of imports of condoms and of chemical contraceptives, and number of new family planning acceptors at SLPPA clinics, by year | |
| Measure | No. |
| Condom imports (kg) | |
| 1995 | 1,791 |
| 1996 | 1,884 |
| 1997 | 2,008 |
| 1998 | 2,904 |
| 1999 | 7,043 |
| Chemical methods imports (kg)† | |
| 1995 | 676 |
| 1996 | 617 |
| 1997 | 1,225 |
| 1998 | 1,197 |
| 1999 | 1,292 |
| New acceptors | |
| 1994 | 879 |
| 1995 | 887 |
| 1996 | 932 |
| 1997 | 1,053 |
| 1998 | 1,107 |
| 1999 | 1,175 |
| †Hormonal and spermicidal methods. | |
![]()
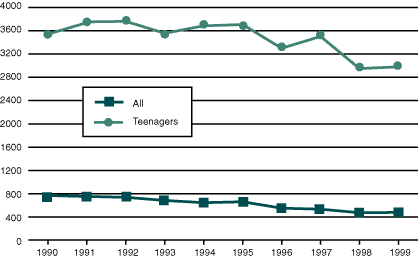
Figure 2. Number of births to all women and teenage women in St. Lucia, 1990-1999 |
| No. of births |
 |
![]()
|
Statement of Accuracy/User Agreement © copyright 2000, The Alan Guttmacher Institute. |
| about | | | e-mail list | | | feedback | | | help | | | home | | | search | | | support us |