International Family Planning Perspectives |
Contraceptive Use, Intention to Use and Unmet Need During the Extended Postpartum Period |
| Table 1. Percentage distribution of all women in the extended postpartum period, by unmet need, contraceptive use and reproductive intention status, according to region and country | ||||||||
| Country | % with unmet need | % using a method | % wanting to give birth within 2 yrs. | |||||
| Total | To space | To limit | Total | Modern | Traditional | |||
| To space | To limit | |||||||
| Total | 64.6 | 39.1 | 25.5 | 29.2 | 9.1 | 10.3 | 9.8 | 5.4 |
| Sub-Saharan Africa | 73.8 | 55.0 | 18.8 | 18.1 | 5.9 | 3.1 | 9.0 | 7.6 |
| Benin | 80.3 | 66.8 | 13.5 | 14.6 | 1.5 | 0.5 | 12.6 | 4.2 |
| Central African Rep. | 64.6 | 53.5 | 11.0 | 25.0 | 1.1 | 0.7 | 23.2 | 9.7 |
| Comoros | 71.7 | 48.8 | 22.9 | 20.0 | 6.1 | 1.6 | 12.3 | 6.4 |
| Côte d'Ivoire | 88.0 | 69.3 | 18.7 | 5.0 | 1.7 | 0.4 | 2.8 | 6.7 |
| Ghana | 84.5 | 55.6 | 28.8 | 11.7 | 2.9 | 1.9 | 6.9 | 3.7 |
| Kenya | 75.2 | 40.0 | 35.3 | 19.5 | 6.1 | 8.5 | 4.9 | 4.3 |
| Mali | 86.8 | 74.8 | 12.0 | 3.6 | 1.3 | 0.2 | 2.2 | 9.3 |
| Mozambique | 77.1 | 66.4 | 10.7 | 4.0 | 2.3 | 1.0 | 0.7 | 18.8 |
| Senegal | 82.7 | 66.2 | 16.5 | 12.2 | 2.9 | 1.3 | 8.1 | 5.1 |
| Uganda | 76.7 | 52.3 | 24.4 | 12.4 | 2.7 | 1.8 | 8.0 | 10.7 |
| Zambia | 60.8 | 43.2 | 17.6 | 29.0 | 9.3 | 2.8 | 16.9 | 9.5 |
| Zimbabwe | 37.8 | 23.4 | 14.5 | 59.7 | 33.4 | 16.8 | 9.5 | 2.1 |
| Middle East | 51.8 | 23.2 | 28.6 | 43.7 | 10.4 | 17.6 | 15.8 | 4.3 |
| Egypt | 57.4 | 25.5 | 31.9 | 37.8 | 13.7 | 20.6 | 3.5 | 4.5 |
| Turkey | 46.1 | 20.8 | 25.3 | 49.6 | 7.0 | 14.6 | 28.0 | 4.0 |
| Asia | 62.3 | 33.2 | 29.1 | 32.2 | 13.4 | 11.6 | 7.2 | 4.5 |
| Bangladesh | 74.3 | 35.3 | 39.0 | 20.9 | 9.1 | 7.4 | 4.4 | 4.1 |
| Indonesia | 54.2 | 30.7 | 23.5 | 42.1 | 23.2 | 17.0 | 1.9 | 3.3 |
| Kazakhstan | 49.4 | 29.1 | 20.3 | 43.5 | 13.1 | 14.3 | 16.0 | 4.2 |
| Nepal | 84.0 | 40.4 | 43.6 | 11.4 | 2.6 | 6.9 | 1.9 | 4.4 |
| Philippines | 66.4 | 30.2 | 36.1 | 29.3 | 4.8 | 9.4 | 15.1 | 3.0 |
| Uzbekistan | 45.8 | 33.6 | 12.2 | 46.0 | 27.7 | 14.6 | 3.8 | 7.7 |
| Latin America | 54.4 | 21.4 | 32.9 | 41.6 | 10.5 | 19.2 | 11.9 | 3.1 |
| Bolivia | 65.9 | 15.6 | 50.3 | 31.0 | 2.1 | 7.1 | 21.8 | 2.6 |
| Brazil | 27.9 | 8.7 | 19.2 | 68.1 | 19.2 | 40.1 | 8.8 | 2.5 |
| Colombia | 29.1 | 10.0 | 19.2 | 68.6 | 18.0 | 29.2 | 21.3 | 1.9 |
| Dominican Republic | 40.2 | 24.0 | 16.2 | 54.0 | 17.4 | 24.5 | 12.2 | 4.0 |
| Guatemala | 79.2 | 46.1 | 33.2 | 14.8 | 4.4 | 7.7 | 2.7 | 4.7 |
| Haiti | 85.3 | 31.7 | 53.6 | 9.7 | 2.0 | 4.2 | 3.5 | 4.5 |
| Peru | 52.8 | 14.0 | 38.8 | 45.2 | 10.5 | 21.8 | 12.9 | 1.2 |
| Notes: Percentages shown in total and regional subtotal rows are unweighted means. Columns do not add to 100% because small percentages of infecund women are omitted. | ||||||||
![]()
| Table 2. Percentage of all women in the extended postpartum period who intend to use contraceptives in the next year, by number of months since last birth | ||||||
| Region and country | 0-12 | 0--3 | 3-6 | 6-9 | 9-12 | >=12 |
| Total | 38.5 | 53.6 | 37.8 | 33.2 | 30.9 | 16.9 |
| Sub-Saharan Africa | 40.6 | 49.5 | 40.6 | 38.6 | 34.2 | 23.3 |
| Benin | 37.1 | 44.4 | 39.9 | 36.5 | 27.7 | 23.1 |
| Central African Rep. | 48.6 | 57.9 | 53.0 | 42.2 | 41.3 | 23.3 |
| Comoros | 42.1 | 50.0 | 46.3 | 47.6 | 26.5 | 20.2 |
| Côte d'Ivoire | 30.7 | 31.8 | 27.5 | 30.4 | 33.1 | 14.1 |
| Ghana | 40.2 | 47.2 | 37.4 | 42.2 | 33.1 | 22.2 |
| Kenya | 50.8 | 66.7 | 48.8 | 46.1 | 45.0 | 24.1 |
| Mali | 42.2 | 41.4 | 44.3 | 39.7 | 43.0 | 25.6 |
| Mozambique | 34.7 | 34.7 | 34.9 | 36.8 | 32.7 | 20.0 |
| Senegal | 33.9 | 42.8 | 33.8 | 30.3 | 28.0 | 19.5 |
| Uganda | 44.1 | 51.1 | 43.9 | 41.9 | 41.2 | 30.4 |
| Zambia | 51.2 | 62.6 | 53.4 | 47.9 | 41.4 | 33.4 |
| Zimbabwe | 31.0 | 63.4 | 23.5 | 21.3 | 17.6 | 24.2 |
| Middle East | 34.8 | 61.6 | 30.5 | 27.0 | 24.0 | 10.6 |
| Egypt | 37.9 | 59.0 | 36.3 | 28.9 | 27.9 | 13.9 |
| Turkey | 31.8 | 64.1 | 24.6 | 25.1 | 20.1 | 7.4 |
| Asia | 38.6 | 56.2 | 40.8 | 29.6 | 29.8 | 10.6 |
| Bangladesh | 57.6 | 70.0 | 61.9 | 52.3 | 44.0 | 13.7 |
| Indonesia | 35.3 | 60.6 | 35.7 | 24.5 | 21.4 | 8.6 |
| Kazakhstan | 38.8 | 65.5 | 38.2 | 20.6 | 36.1 | 7.8 |
| Nepal | 44.7 | 57.5 | 47.8 | 38.8 | 35.0 | 16.5 |
| Philippines | 34.9 | 51.8 | 36.7 | 29.4 | 25.6 | 9.7 |
| Uzbekistan | 20.0 | 31.6 | 24.7 | 12.1 | 16.7 | 7.1 |
| Latin America | 35.8 | 56.2 | 32.6 | 29.0 | 28.2 | 13.1 |
| Bolivia | 44.3 | 57.5 | 48.4 | 38.5 | 35.0 | 16.8 |
| Brazil | 25.3 | 55.8 | 18.2 | 17.8 | 14.9 | 6.8 |
| Colombia | 24.3 | 50.6 | 22.0 | 17.9 | 13.3 | 9.3 |
| Dominican Republic | 34.6 | 62.0 | 22.4 | 21.9 | 31.1 | 11.4 |
| Guatemala | 32.4 | 44.9 | 28.4 | 28.1 | 28.9 | 12.0 |
| Haiti | 47.1 | 58.2 | 45.2 | 41.9 | 44.5 | 23.7 |
| Peru | 42.8 | 64.1 | 43.7 | 36.8 | 29.9 | 11.7 |
![]()
| Table 3. Percentage distribution of all women in union who have ever given birth and who have an unmet need, and percentage distribution of all women in union who have ever given birth and who intend to use a contraceptive method within the next 12 months, by number of months after birth, according to region and country | ||||||||
| Region and country | With unmet need | Intending to use | ||||||
| 0-11 | 12-23 | >=24 | Total | 0-11 | 12-23 | >=24 | Total | |
| Total | 39.3 | 25.1 | 35.7 | 100.0 | 38.3 | 25.1 | 36.6 | 100.0 |
| Sub-Saharan Africa | 41.3 | 27.2 | 31.5 | 100.0 | 37.3 | 27.2 | 35.5 | 100.0 |
| Benin | 45.1 | 26.6 | 28.3 | 100.0 | 36.5 | 25.1 | 38.4 | 100.0 |
| Central African Rep. | 43.4 | 27.7 | 28.9 | 100.0 | 40.3 | 27.8 | 31.9 | 100.0 |
| Comoros | 38.9 | 25.7 | 35.4 | 100.0 | 41.7 | 25.6 | 32.7 | 100.0 |
| Côte d'Ivoire | 45.8 | 28.4 | 25.8 | 100.0 | 40.5 | 27.8 | 31.6 | 100.0 |
| Ghana | 38.3 | 24.1 | 37.6 | 100.0 | 37.4 | 25.3 | 37.3 | 100.0 |
| Kenya | 37.9 | 28.9 | 33.2 | 100.0 | 38.3 | 30.8 | 31.0 | 100.0 |
| Mali | 47.7 | 27.4 | 24.9 | 100.0 | 38.6 | 26.5 | 34.8 | 100.0 |
| Mozambique | 40.4 | 29.0 | 30.6 | 100.0 | 35.5 | 29.3 | 35.2 | 100.0 |
| Senegal | 35.3 | 27.7 | 37.0 | 100.0 | 37.8 | 29.5 | 32.7 | 100.0 |
| Uganda | 43.9 | 34.3 | 21.8 | 100.0 | 37.8 | 35.8 | 26.4 | 100.0 |
| Zambia | 42.9 | 27.8 | 29.3 | 100.0 | 36.7 | 27.5 | 35.8 | 100.0 |
| Zimbabwe | 35.7 | 18.4 | 45.8 | 100.0 | 25.1 | 14.3 | 60.6 | 100.0 |
| Middle East | 40.0 | 20.0 | 40.0 | 100.0 | 39.0 | 19.7 | 41.3 | 100.0 |
| Egypt | 41.2 | 21.3 | 37.5 | 100.0 | 37.7 | 21.2 | 41.1 | 100.0 |
| Turkey | 38.7 | 18.8 | 42.6 | 100.0 | 40.1 | 18.2 | 41.7 | 100.0 |
| Asia | 36.5 | 22.8 | 40.7 | 100.0 | 40.4 | 23.2 | 36.4 | 100.0 |
| Bangladesh | 44.0 | 22.3 | 33.6 | 100.0 | 45.0 | 21.6 | 33.3 | 100.0 |
| Indonesia | 40.0 | 19.2 | 40.7 | 100.0 | 38.7 | 15.4 | 46.0 | 100.0 |
| Kazakhstan | 23.4 | 15.2 | 61.4 | 100.0 | 36.4 | 23.8 | 39.9 | 100.0 |
| Nepal | 38.3 | 30.1 | 31.6 | 100.0 | 40.9 | 29.6 | 29.6 | 100.0 |
| Philippines | 40.4 | 26.0 | 33.6 | 100.0 | 47.6 | 23.5 | 28.9 | 100.0 |
| Uzbekistan | 33.7 | 23.9 | 42.4 | 100.0 | 33.2 | 24.9 | 41.9 | 100.0 |
| Latin America | 38.0 | 24.7 | 37.4 | 100.0 | 38.1 | 24.4 | 37.5 | 100.0 |
| Bolivia | 41.7 | 26.5 | 31.8 | 100.0 | 42.4 | 26.0 | 31.6 | 100.0 |
| Brazil | 31.0 | 21.6 | 47.5 | 100.0 | 31.3 | 21.7 | 47.1 | 100.0 |
| Colombia | 33.3 | 20.3 | 46.4 | 100.0 | 29.8 | 19.7 | 50.5 | 100.0 |
| Dominican Republic | 37.1 | 24.4 | 38.6 | 100.0 | 35.1 | 26.3 | 38.7 | 100.0 |
| Guatemala | 45.5 | 29.7 | 24.8 | 100.0 | 45.5 | 26.2 | 28.3 | 100.0 |
| Haiti | 34.7 | 27.1 | 38.2 | 100.0 | 38.6 | 27.9 | 33.5 | 100.0 |
| Peru | 41.8 | 22.8 | 35.4 | 100.0 | 41.6 | 22.1 | 36.3 | 100.0 |
| Note: As elsewhere, the table excludes women who have never given birth. | ||||||||
![]()
| Table 4. Among postpartum women, percentage intending to use a contraceptive method who have an unmet need, and percentage with an unmet need who intend to use a method | ||
| Region and country | Intending who have unmet need | Having unmet need who intend to use |
| Total | 98.3 | 66.5 |
| Sub-Saharan Africa | 94.2 | 58.1 |
| Benin | 96.0 | 46.3 |
| Central African Rep. | 93.1 | 75.9 |
| Comoros | 93.7 | 60.4 |
| Côte d'Ivoire | 96.8 | 34.3 |
| Ghana | 98.6 | 48.0 |
| Kenya | 96.8 | 69.1 |
| Mali | 94.8 | 48.4 |
| Mozambique | 84.3 | 39.6 |
| Senegal | 98.0 | 41.6 |
| Uganda | 93.6 | 59.0 |
| Zambia | 89.4 | 81.7 |
| Zimbabwe | 95.0 | 92.5 |
| Middle East | 95.8 | 76.1 |
| Egypt | 95.8 | 73.7 |
| Turkey | 95.9 | 78.6 |
| Asia | 95.8 | 66.7 |
| Bangladesh | 98.0 | 86.9 |
| Indonesia | 95.4 | 72.8 |
| Kazakhstan | 95.7 | 85.0 |
| Nepal | 98.6 | 56.1 |
| Philippines | 95.2 | 53.4 |
| Uzbekistan | 91.8 | 46.1 |
| Latin America | 94.4 | 77.8 |
| Bolivia | 97.5 | 70.1 |
| Brazil | 91.7 | 99.9 |
| Colombia | 93.7 | 96.7 |
| Dominican Republic | 90.6 | 93.6 |
| Guatemala | 93.2 | 40.1 |
| Haiti | 98.1 | 56.9 |
| Peru | 96.4 | 87.6 |
![]()
| Table 5. Percentage of women having a birth who gave birth in a health facility, and percentage who had received tetanus injections prior to delivery, by region and country | ||
| Region and country | Delivered in facility | Received tetanus injections |
| Total | 48.7 | 60.5 |
| Sub-Saharan Africa | 45.1 | 67.4 |
| Benin | 64.4 | 69.3 |
| Central African Rep. | 47.0 | 61.9 |
| Comoros | 40.8 | 50.7 |
| Côte d'Ivoire | 42.7 | 71.0 |
| Ghana | 41.9 | 73.7 |
| Kenya | 39.1 | 87.2 |
| Mali | 33.7 | 48.6 |
| Mozambique | 39.1 | 33.8 |
| Senegal | 49.3 | 82.9 |
| Uganda | 33.9 | 74.1 |
| Zambia | 42.7 | 77.0 |
| Zimbabwe | 67.0 | 78.9 |
| Middle East | 51.1 | 56.6 |
| Egypt | 38.0 | 70.0 |
| Turkey | 64.3 | 43.2 |
| Asia | 42.9 | 64.0 |
| Bangladesh | 6.4 | 74.4 |
| Indonesia | 19.2 | 69.9 |
| Kazakhstan | 98.7 | u |
| Nepal | 9.4 | 44.6 |
| Philippines | 30.8 | 67.2 |
| Uzbekistan | 92.8 | u |
| Latin America | 59.1 | 65.0 |
| Bolivia | 40.7 | 38.4 |
| Brazil | 93.8 | 56.1 |
| Colombia | 80.9 | 79.0 |
| Dominican Republic | 97.5 | 95.7 |
| Guatemala | 34.8 | 52.6 |
| Haiti | 15.1 | 62.1 |
| Peru | 51.2 | 71.1 |
| Notes: Questions on place of delivery and receipt of tetanus toxoid injections were asked of women who had given birth in a certain number of years preceding the survey; the period ranged from three years to five years, depending on the country. u=unavailable, because it was not asked in the questionnaire. | ||
![]()
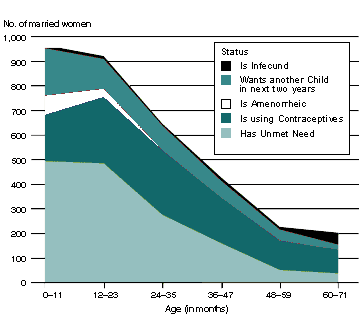
Figure 1. Number of married women with at least one child, by age of youngest child (in months), according to fertility and intention status, Kenya, 1998 |
 |
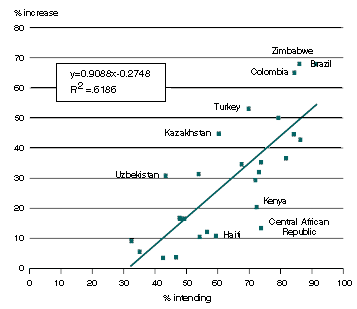
Figure 2. Among women 0-3 months postpartum who are not using contraceptives, percentage who say they intend to do so within the next 12 months, by percentage increase in contraceptive prevalence among women between 0-3 months and 9-12 months postpartum |
 |
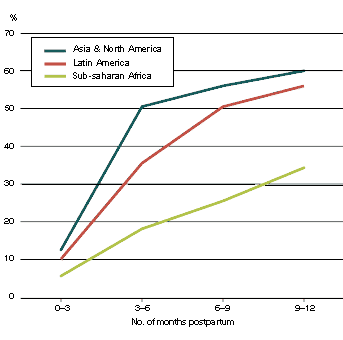
Figure 3. Percentage of postpartum women who have resumed menstruation, by number of months postpartum, according to region |
 |
| © copyright 2001, The Alan Guttmacher Institute. |