International Family Planning Perspectives | |
|
Excess Capacity and the Cost of Adding Services |
| TABLE 1. Percentage of new contraceptive users who received specified services, before and after staff were retrained in syndromic management, by type of service, Spilhaus and Mpilo clinics, Zimbabwe, 1998 | ||
| Service | Before | After |
| (N=14) | (N=20) | |
| Risk assessment | 14.3 | 40.0 |
| Pelvic exam | 50.0 | 70.0 |
| Specimens for STI lab tests | 0.0 | 30.0 |
![]()
| TABLE 2. Mean and median duration (in minutes) of family planning visits for new contraceptive users and resupply or repeat family planning clients at posttest, by services provided, Spilhaus, Mpilo and Lister clinics | |||
| Provision of risk assessment | Service | ||
| Pelvic exam, lab test | Pelvic exam, no lab test | No pelvic exam, no lab test | |
| Provided | |||
| Mean | 43 | 26* | 10† |
| Median | 43 | 25 | 10 |
| N | 23 | 7 | 9 |
| Not provided | |||
| Mean | 58 | 26‡ | 10§ |
| Median | 38 | 22 | 8 |
| N | 3 | 18 | 127 |
| *Difference between this value and value immediately to the left is statistically significant at p=.002. †Difference between this value and value immediately to the left is statistically significant at p=.004. ‡Difference between this value and value immediately to the left is statistically significant at p=.034. §Difference between this value and value immediately to the left is statistically significant at p=.000. Note: Mann-Whitney and Wilcoxon tests were used to determine the statistical significance of differences in means. | |||
![]()
| TABLE 3. Selected measures of client visits and time spent with clients, and of the potential impact of implementing syndromic management, Spilhaus, Mpilo and Lister clinics | |||
| Measure | Spilhaus | Mpilo | Lister |
| Mean no. of visits per provider per day | 7.1 | 10.7 | 5.5 |
| Adjusted mean no. of visits per provider per day* | 9.5 | 11.8 | 8.5 |
| Mean length of visits (in minutes) | 22.7 | 17.0 | 19.1 |
| Mean daily contact time per provider per day (in minutes)† | 217.1 | 199.7 | 161.7 |
| Average no. of visits per provider per day for new acceptors, repeat clients and "other" clients‡ | 6.3 | 10.5 | 6.8 |
| % of such clients who should have received syndromic management§ | 47.1 | 42.8 | 57.9 |
| % of such clients who received syndromic management** | 40.8 | 32.4 | 17.5 |
| Additional time needed to offer syndromic management to targeted clients (in minutes) | 6.1 | 18.6 | 43.2 |
| Time needed for lab tests (in minutes)†† | 22.1 | 30.6 | 8.5 |
| Net change in daily contact time per provider (in minutes) | -16 | -12 | +34.7 |
| Mean daily contact time per provider per day if syndromic management were implemented (in minutes) | 201.1 | 187.7 | 196.4 |
| *Adjusted number of visits was calculated by dividing mean total contact time from time-motion study by mean visit length observed in the mini-situation analysis. †Mean daily contact time equals adjusted mean no. of visits multiplied by mean length of visits. ‡New acceptors, repeat clients and "other" family planning visitors constituted 66% of all visits at Spilhaus, 89% of all visits at Mpilo and 80% of all visits at Lister; STI clients accounted for most of the remaining visits. §Based on the assumption that all new contraceptive users, one-third of repeat family planning clients, and half of "other" clients should receive syndromic management. **Based on the percentage of such clients who received pelvic examinations. ††For Spilhaus, 21% of targeted clients had specimens collected; 21% of 6.3 visits=1.3 visits. Seventeen minutes was needed for specimen collection; 1.3 visits x 17 minutes=22.1 minutes. For Mpilo, 17% of targeted clients had specimens collected; 17% of 10.5 visits=1.8 visits. Seventeen minutes was needed for specimen collection; 1.8 visits x 17 minutes=30.6 minutes. For Lister, 7% of targeted clients had specimens collected; 7% of 6.8 visits=0.5 visits. Seventeen minutes was needed for specimen collection; 0.5 visits x 17 minutes=8.5 minutes. | |||
![]()
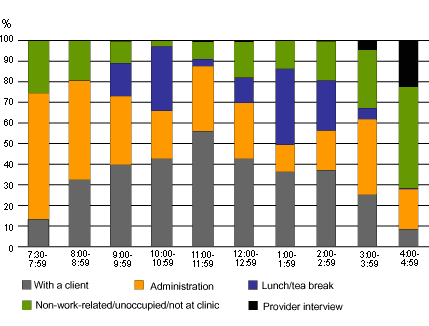
| FIGURE 1. Percentage distribution of of provider time by selected activities, according to hour of the day |
 |
Notes: Administrative tasks included completing and reviewing forms, filing forms, preparing work space, preparing for the next client, engaging in work-related discussions with staff, participating in official meetings, reading and making phone calls. The time-motion study was based on observations made over a five-day period of three providers at each clinic. Spilhaus and Lister opened at 8:00 a.m. and closed at 4:30 p.m.; Mpilo opened at 7:30 a.m. and closed at 4:00 p.m. Thus, the first bar refers only to Mpilo, while the last bar refers only to Spilhaus and Lister. |
![]()
| TABLE 4. Mean daily staff time (in minutes) and percentage distribution of time spent on selected activities, Spilhaus, Mpilo and Lister clinics | ||||||||
| Activity | All clinics | Spilhaus | Mpilo | Lister | ||||
| Mean | % | Mean | % | Mean | % | Mean | % | |
| With a client | 192 | 37.6 | 217 | 42.5 | 200 | 39.2 | 162 | 31.8 |
| Visit-related tasks* | 80 | 15.7 | 63 | 12.4 | 123 | 24.1 | 51 | 10.0 |
| Other work activities† | 70 | 13.7 | 43 | 8.4 | 49 | 9.6 | 113 | 22.2 |
| Lunch/tea break | 79 | 15.5 | 81 | 15.9 | 83 | 16.3 | 75 | 14.7 |
| Non-work-related/unoccupied/not at clinic | 80 | 15.7 | 94 | 18.4 | 46 | 9.0 | 102 | 20.0 |
| Provider interview | 9 | 1.8 | 12 | 2.4 | 9 | 1.8 | 7 | 1.4 |
| Total | 510 | 100.0 | 510 | 100.0 | 510 | 100.0 | 510 | 100.0 |
| *Completing or reviewing forms, filing forms, preparing work space and preparing for next client. †Work-related discussions with staff, official meetings, reading and phone calls. | ||||||||
![]()
| TABLE 5. Visit cost (in US$) for provision of selected methods in Spilhaus, Mpilo and Lister clinics, and in 1995 Zimbabwe study | |||||
| Method provided | All | Spilhaus | Mpilo | Lister | 1995 study |
| Pill | 2.49 | 2.53 | 2.19 | 2.73 | 2.54 |
| IUD | 3.77 | 3.82 | 3.47 | 4.01 | 2.94-8.70 |
| Injectable | 2.86 | 2.90 | 2.56 | 3.10 | 2.77 |
| Source: 1995 study--see reference 2. | |||||
![]()
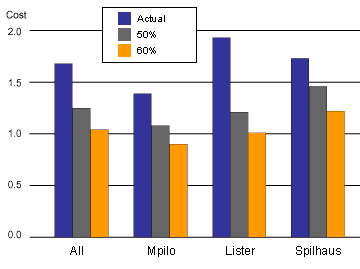
| FIGURE 2. Labor cost per visit in US$, by varying percentages of time spent with clients, according to clinic |
 |
| © copyright 2002, the Alan Guttmacher Institute. |