International Family Planning Perspectives
Volume 28, Number 3, September 2002 | |
|
Fertility Regulation Among Women in Abidjan, Côte d'Ivoire: Contraception, Abortion or Both? |
| TABLE 1. Selected measures of contraceptive knowledge, current method use and abortion among 2,400 female health clinic clients, by selected characteristics, Abidjan, 1998 | |||||
| Characteristic | Knowledge | Current use | Ever had an abortion | ||
| Any method | Modern method | Any method | Modern method | ||
| All women | 96.4 | 94.6 | 28.1 | 11.6 | 33.5 |
| Age | |||||
| <25 | 94.8*** | 93.3*** | 28.6 | 11.9 | 27.8*** |
| 25-34 | 98.6 | 96.8 | 27.2 | 11.4 | 41.0 |
| >=35 | 96.5 | 93.1 | 29.0 | 10.8 | 35.5 |
| Education | |||||
| None | 92.4*** | 88.9*** | 15.4*** | 5.5*** | 18.0*** |
| Primary | 97.9 | 96.4 | 29.5 | 10.9 | 36.3 |
| >=secondary | 100.0 | 100.0 | 43.4 | 20.3 | 51.0 |
| Religion | |||||
| Christian | 98.9*** | 97.8*** | 38.0*** | 15.7*** | 46.5*** |
| Muslim | 93.6 | 91.4 | 18.5 | 8.0 | 13.6 |
| Other | 96.2 | 93.9 | 25.4 | 9.7 | 41.3 |
| Marital status | |||||
| Unmarried† | 98.0*** | 96.8*** | 43.2*** | 17.9*** | 41.9*** |
| Married | 95.6 | 93.6 | 21.3 | 8.8 | 29.8 |
| Occupation | |||||
| Trader | 95.9*** | 94.0*** | 24.4*** | 9.3*** | 30.1*** |
| Student | 99.4 | 99.4 | 50.0 | 27.1 | 34.7 |
| Office worker | 98.3 | 97.2 | 40.6 | 16.7 | 58.3 |
| Housewife | 94.6 | 91.8 | 22.7 | 8.3 | 26.5 |
| Artisan | 94.6 | 98.3 | 34.0 | 15.3 | 46.3 |
| ***Differences were statistically significant at p<.001 (chi-square tests). †Includes women who never married and those who were separated, widowed or divorced. | |||||
![]()
| TABLE 2. Percentage distribution of women in each fertility regulation subgroup, by selected characteristics | ||||
| Characteristic | No fertility regulation | Contraception alone | Contraception and abortion | Abortion alone |
| (N=646) | (N=949) | (N=729) | (N=76) | |
| No. of pregnancies | ||||
| 0 | 22.9 | 19.7 | na | na |
| 1 | 24.1 | 26.3 | 11.9 | 13.2 |
| 2-3 | 27.7 | 28.8 | 40.6 | 40.8 |
| 4-5 | 14.1 | 14.8 | 27.8 | 22.4 |
| 6-7 | 6.3 | 6.2 | 11.8 | 10.5 |
| >=8 | 4.8 | 4.2 | 7.8 | 13.2 |
| Age | ||||
| <25 | 60.7 | 53.3 | 42.0 | 51.3 |
| 25-34 | 28.8 | 36.2 | 46.6 | 36.8 |
| >=35 | 10.5 | 10.4 | 11.4 | 11.8 |
| Education | ||||
| None | 70.3 | 32.6 | 17.1 | 55.3 |
| Primary | 22.8 | 35.5 | 35.0 | 27.6 |
| >=secondary | 7.0 | 31.9 | 47.9 | 17.1 |
| Religion | ||||
| Christian | 20.7 | 41.5 | 58.6 | 42.1 |
| Muslim | 61.5 | 36.2 | 14.0 | 19.7 |
| Other | 17.8 | 22.2 | 27.4 | 38.2 |
| Marital status | ||||
| Unmarried† | 20.1 | 31.9 | 39.1 | 35.5 |
| Married | 79.9 | 68.1 | 60.9 | 64.5 |
| Occupation | ||||
| Trader | 51.7 | 46.5 | 39.2 | 61.8 |
| Student | 3.7 | 9.2 | 7.7 | 3.9 |
| Office worker | 2.9 | 5.9 | 14.0 | 3.9 |
| Housewife | 36.1 | 25.6 | 21.3 | 22.4 |
| Artisan | 5.6 | 12.9 | 17.8 | 7.9 |
| Total | 100.0 | 100.0 | 100.0 | 100.0 |
| †Includes women who never married and those who were separated, widowed or divorced. Note: na=not applicable. | ||||
![]()
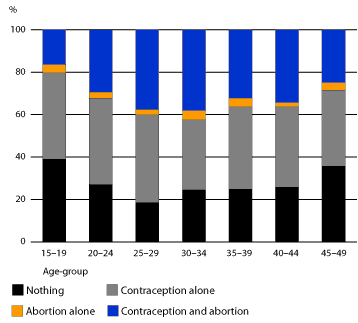
FIGURE 1. Percentage distribution of women in seven age-groups by fertility regulation subgroup |
 |
![]()
| TABLE 3. Odds ratios (and 95% confidence intervals) from multinomial regression analyses predicting women's reliance on contraception alone, abortion alone or both contraception and abortion to regulate fertility vs. doing nothing | |||
| Characteristic | Contraception alone (N=949) | Abortion alone (N=76) | Both contraception and abortion (N=729) |
| No. of pregnancies | 1.07 (1.00-1.15) | 1.75 (1.52-2.02)** | 1.85 (1.69-2.02)** |
| Religion | |||
| Christian (ref) | 1.00 | 1.00 | 1.00 |
| Muslim | 0.52 (0.39-0.68)** | 0.16 (0.08-0.32)** | 0.17 (0.12-0.24)** |
| Other | 0.87 (0.63-1.20) | 1.13 (0.63-2.02) | 0.80 (0.57-1.14) |
| Age | |||
| <25 | 0.68 (0.52-0.90)** | 1.95 (1.00-3.76)* | 0.98 (0.70-1.38) |
| 25-34 (ref) | 1.00 | 1.00 | 1.00 |
| >=35 | 0.65 (0.42-0.99)* | 0.11 (0.04-0.30)** | 0.09 (0.05-0.16)** |
| Occupation | |||
| Trader (ref) | 1.00 | 1.00 | 1.00 |
| Student | 0.48 (0.26-0.90)* | 0.24 (0.06-1.01) | 0.36 (0.18-0.72)** |
| Office worker | 1.14 (0.63-2.09) | 0.71 (0.19-2.64) | 2.51 (1.33-4.74)** |
| Housewife | 0.70 (0.54-0.90)** | 0.45 (0.24-0.83)* | 0.66 (0.47-0.91)* |
| Artisan | 1.64 (1.07-2.52)* | 0.86 (0.33-2.23) | 2.80 (1.75-4.47)** |
| Marital status | |||
| Unmarried† | 1.40 (1.06-1.86)** | 2.96 (1.65-5.34)** | 3.13 (2.25-4.36)** |
| Married (ref) | 1.00 | 1.00 | 1.00 |
| Education | |||
| None (ref) | 1.00 | 1.00 | 1.00 |
| Primary | 2.71 (2.09-3.52)** | 1.02 (0.56-1.86) | 4.48 (3.19-6.29)** |
| >=secondary | 10.07 (6.54-15.49)** | 4.04 (1.77-9.20)** | 33.81 (20.8-54.9)** |
| *p<.05. **p<.01. †Includes women who never married and those who were separated, widowed or divorced. Notes: The group doing nothing to regulate fertility included 646 women. ref=reference category. | |||
| |||||
| |||||
| © copyright 2002, The Alan Guttmacher Institute. |