| TABLE 1. Percentage distribution of adolescents attending a municipal STD clinic and HMO adolescent clinic, by selected characteristics, according to sex | ||
| Characteristic | Females | Males |
| (N=295) | (N=141) | |
| Race/ethnicity | ||
| White | 20.0 | 12.8 |
| Black | 27.5 | 29.1 |
| Hispanic | 18.0 | 22.0 |
| Asian/Pacific Islander | 17.6 | 15.6 |
| Mixed/other | 16.9 | 20.6 |
| Site | ||
| STD clinic | 41.7 | 48.9 |
| HMO clinic | 58.3 | 51.1 |
| Partner type | ||
| Main only | 62.4 | 44.7 |
| Main and casual | 30.5 | 32.6 |
| Casual only | 7.1 | 22.7 |
| Method use with main partner | ||
| Condoms only | 35.8 | 49.5 |
| Hormonal contraceptives only | 23.0 | 13.8 |
| Both | 13.9 | 10.1 |
| None | 27.4 | 26.6 |
| Method use with casual partner | ||
| Condoms only | 52.3 | 71.8 |
| Hormonal contraceptives only | 5.4 | 1.3 |
| Both | 23.4 | 9.0 |
| None | 18.9 | 17.9 |
| Total | 100.0 | 100.0 |
![]()
| TABLE 2. Percentage of adolescents who used condoms at last intercourse with a main partner, by selected characteristics; and mean age and relationship length (and standard deviations) of adolescents, by whether condoms were used--all according to sex | ||
| Variable | Females | Males |
| (N=274) | (N=109) | |
| PERCENTAGES | ||
| Used hormonal contraceptives | ||
| Yes | 37.6** | 42.3* |
| No | 56.6 | 65.1 |
| Site | ||
| STD clinic | 43.5 | 49.1* |
| HMO clinic | 53.6 | 71.2 |
| Partner type | ||
| Main and casual | 56.7 | 69.6 |
| Main only | 46.2 | 52.4 |
| MEANS | ||
| Age | ||
| Used condoms | 16.6 (1.3)** | 16.9 (1.5)** |
| Did not use condoms | 17.1 (1.3) | 17.9 (1.2) |
| Relationship length (mos.) | ||
| Used condoms | 15.8 (17.7) | 12.0 (11.3)* |
| Did not use condoms | 18.9 (15.7) | 18.2 (17.8) |
| *p<.05. **p<.01. | ||
![]()
| TABLE 3. Odds ratios (and 95% confidence intervals) from logistic regression analyses predicting the effects of various characteristics and perceptions on the likelihood of condom use at last intercourse with a main partner, by sex | ||
| Variable | Females | Males |
| Characteristic | ||
| Used hormonal contraceptive at last intercourse | 0.42 (0.24-0.74)** | 0.26 (0.09-0.77)* |
| STD clinic | 1.41 (0.78-2.54) | 1.66 (0.59-4.66) |
| Age | 0.74 (0.60-0.92)** | 0.74 (0.50-1.09) |
| Relationship length | 1.00 (0.98-1.01) | 0.98 (0.95-1.01) |
| X2 | 24.1** | 20.8** |
| Perception | ||
| Negative view of becoming pregnant | 1.08 (0.99-1.18) | 1.13 (0.96-1.33) |
| At risk of becoming pregnant | 1.06 (0.93-1.21) | 0.99 (0.75-1.29) |
| Negative view of acquiring STD | 1.08 (1.00-1.16) | 1.16 (1.00-1.34)* |
| At risk of acquiring STD | 1.06 (1.02-1.11)** | 1.07 (0.99-1.17) |
| X2 | 20.0** | 13.5** |
| Two-way interactions | ||
| Hormonal contraceptive use x pregnancy negative | 0.75 (0.62-0.91)** | 0.82 (0.56-1.19) |
| Hormonal contraceptive use x at risk of acquiring STD | 1.17 (1.05-1.30)** | 1.05 (0.82-1.33) |
| Pregnancy negative x at risk of acquiring STD | 1.00 (0.98-1.01) | 0.97 (0.94-1.00)† |
| X2 | 17.8** | 4.1 |
| Three-way interaction | ||
| Hormonal contraceptive use x pregnancy negative x at risk of acquiring STD | 0.95 (0.91-0.99)* | 0.82 (0.69-0.99)* |
| X2 | 6.3* | 7.5** |
| X2 for model | 68.2** | 45.9** |
| *p<.05. **p<.01. †p<.10. | ||
![]()
| TABLE 4. Odds ratios (and 95% confidence intervals) from logistic regression analyses predicting the likelihood of female adolescents' condom use at last intercourse with a main partner, by selected characteristics, according to adolescents' perceptions about becoming pregnant and their risk of acquiring an STD | ||||
| Variable | Negative view of becoming pregnant | Risk of acquiring STD | ||
| More | Less | Higher | Lower | |
| (N=128) | (N=146) | (N=131) | (N=143) | |
| Used hormonal contraceptive at last intercourse last intercourse | 0.14 (0.06-0.36)** | 0.79 (0.39-1.61) | 0.86 (0.38-1.94) | 0.21 (0.09-0.46)** |
| STD clinic | 3.55(1.37-9.23)** | 1.02 (0.49-2.14) | 1.70 (0.77-3.75) | 1.58 (0.70-3.55) |
| Age | 0.68 (0.48-0.95)* | 0.77 (0.58-1.01) | 0.81 (0.61-1.07) | 0.74 (0.54-1.02) |
| Relationship length | 1.00 (0.97-1.03) | 1.00 (0.98-1.02) | 1.00 (0.98-1.02) | 0.98 (0.95-1.00) |
| X2 | 29.5** | 5.5 | 6.0 | 26.1** |
| *p<.05. **p<.01. | ||||
![]()
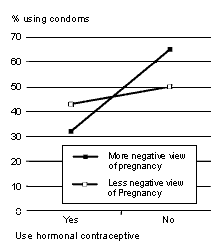
FIGURE 1. Percentage of adolescent women using condoms with a main partner, by whether they use hormonal contraceptives, according to how negatively they would view a pregnancy |
 |
![]()
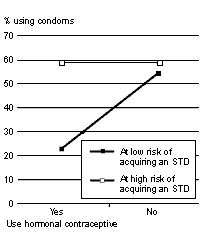
FIGURE 2. Percentage of adolescent women using condoms with a main partner, by whether they use hormonal contraceptives, according to their perceived risk of acquiring an STD |
 |
![]()
| TABLE 5. Odds ratios (and 95% confidence intervals) from logistic regression analyses predicting the likelihood of female adolescents' condom use with main and casual partners, by selected characteristics, according to partner type | ||
| Variable | Main partner | Casual partner |
| (N=90) | (N=90) | |
| Used hormonal contraceptive | ||
| at last intercourse | 0.27 (0.09-0.80)* | 2.02 (0.62-6.61) |
| STD clinic | 0.45 (0.15-1.30) | 1.04 (0.34-3.20) |
| Age | 0.70 (0.48-1.02) | 0.84 (0.57-1.23) |
| Relationship length | 1.00 (0.97-1.03) | 1.05 (0.98-1.13) |
| X2 | 14.7** | 4.7 |
| *p<.05. **p<.01. | ||
| ||||||
|
| © copyright 2002, The Alan Guttmacher Institute. |