Perspectives on Sexual and Reproductive Health
Volume 34, Number 6, November/December 2002 | |
|
Sexual Intercourse and the Age Difference |
| TABLE 1. Percentage distribution of adolescent females with a romantic partner, by selected characteristics, National Longitudinal Study of Adolescent Health, 1995 | ||||||||
| Characteristic | % (N=1,975) | |||||||
| Age at start of relationship | ||||||||
| <13 | 25.8 | |||||||
| 14 | 18.8 | |||||||
| 15 | 20.8 | |||||||
| 16 | 19.9 | |||||||
| >=17 | 14.7 | |||||||
| Partner age | ||||||||
| Younger/same age* | 28.2 | |||||||
| 1 yr. older | 23.7 | |||||||
| 2-3 yrs. older | 32.6 | |||||||
| 4-5 yrs. older | 10.2 | |||||||
| >=6 yrs. older | 5.3 | |||||||
| Race/ethnicity | ||||||||
| White | 68.5 | |||||||
| Black | 15.0 | |||||||
| Hispanic | 10.6 | |||||||
| Other | 6.0 | |||||||
| Religion | ||||||||
| Baptist | 23.7 | |||||||
| Catholic | 24.0 | |||||||
| Other | 40.8 | |||||||
| None | 11.5 | |||||||
| Mother figure at home | ||||||||
| Yes | 93.8 | |||||||
| No | 6.2 | |||||||
| Mother's education | ||||||||
| <college graduate | 76.8 | |||||||
| College graduate | 23.2 | |||||||
| Total | 100.0 | |||||||
| *Includes partners older by less than one year. Note: Percentages are weighted; N is unweighted. | ||||||||
![]()
| TABLE 2. Percentage distribution of adolescent females with a romantic partner, and percentage who have had intercourse with that partner, by age gap between partners, according to female's age at start of relationship | ||
| Age and age gap | All | Have had intercourse |
| Females aged <13 | (N=485) | (N=131) |
| Partner younger/same age* | 16.4 | 8.5 |
| Partner older by 1-3 yrs. | 63.6 | 23.3 |
| Partner older by >=4 yrs. | 19.9 | 40.8 |
| Total | 100.0 | 24.3 |
| Females aged 14-15 | (N=794) | (N=327) |
| Partner younger/same age* | 27.7 | 23.1 |
| Partner older by 1-3 yrs. | 59.3 | 42.9 |
| Partner older by >=4 yrs. | 13.1 | 67.4 |
| Total | 100.0 | 40.6 |
| Females aged >=16 | (N=696) | (N=399) |
| Partner younger/same age* | 37.4 | 55.0 |
| Partner older by 1-3 yrs. | 47.6 | 59.0 |
| Partner older by >=4 yrs. | 15.0 | 67.9 |
| Total | 100.0 | 58.8 |
| *Includes partners older by less than one year. Note: Percentages are weighted; Ns are unweighted. | ||
![]()
FIGURE 1. Odds ratios from logistic regression analysis indicating the association between partners' age gap and females' having had intercourse with a romantic partner, by female's age |
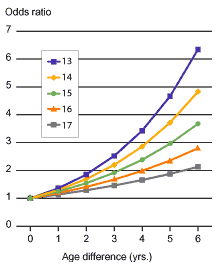 |
Notes: Odds ratios were adjusted for respondent's race or ethnicity, respondent's religion, presence of mother figure at home and mother's education. The reference for each age was the group of females with a same-age partner. |
|
|
|
|
| © copyright 2002, The Alan Guttmacher Institute. |