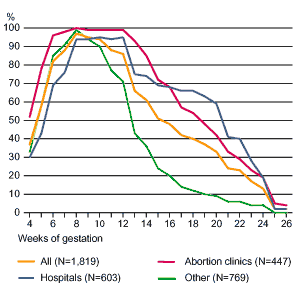
| FIGURE 1. Percentage of facilities performing abortions, by gestational age at which abortions are performed, according to type of facility, 2001 |
 |
Perspectives on Sexual and Reproductive Health
Volume 35, Number 1, January/February
2003 | |
|
The Accessibility of Abortion Services |
| FIGURE 1. Percentage of facilities performing abortions, by gestational age at which abortions are performed, according to type of facility, 2001 |
 |
![]()
| TABLE 1. Mean, median and range in charges for nonhospital surgical abortion, by weeks of gestation, according to type of facility, 2001 | ||||
| Weeks of gestation and change | All | Abortion clinics | Other clinics | Physicians' offices |
| 6 weeks | ||||
| Mean charge | $461 | $362 | $440 | $599 |
| Median charge | 375 | 340 | 375 | 500 |
| Range | 150-4,000 | 170-1,380 | 150-4,000 | 150-1,765 |
| 10 weeks | ||||
| Mean charge | 468 | 364 | 426 | 632 |
| Median charge | 370 | 350 | 370 | 500 |
| Range | 150-4,000 | 170-1,380 | 150-4,000 | 200-1,765 |
| 16 weeks | ||||
| Mean charge | 774 | 720 | 758 | 855 |
| Median charge | 650 | 650 | 632 | 700 |
| Range | 250-4,000 | 300-2,200 | 250-4,000 | 300-3,000 |
| 20 weeks | ||||
| Mean charge | 1,179 | 1,290 | 1,178 | 1,051 |
| Median charge | 1,042 | 1,100 | 1,100 | 1,000 |
| Range | 300-3,000 | 675-3,000 | 450-2,500 | 300-2,000 |
![]()
| TABLE 2. Mean charge for nonhospital surgical abortion at 10 weeks of gestation, by caseload, according to type of facility, 2001 | ||||
| Caseload | All | Abortion clinics | Other clinics | Physicians' offices |
| <30 | $787 | $ * | $827 | $782 |
| 30-390 | 488 | 353 | 434 | 528 |
| 400-990 | 368 | 362 | 372 | na |
| 1,000-4,990 | 369 | 365 | 381 | na |
| >=5,000 | 356 | 350 | * | na |
| *Too few cases to produce reliable statistics. Note: na=not applicable, because physicians' offices responsible for 400 or more abortions are classified as clinics. | ||||
![]()
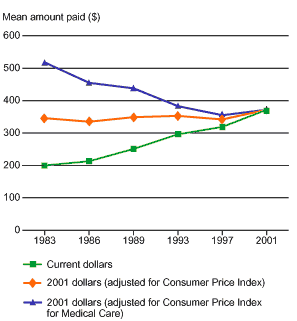
| FIGURE 2. Mean amount paid for a nonhospital abortion at 10 weeks LMP, by dollar measure, selected years, 1983-2001 |
 |
![]()
| TABLE 3. Percentage distribution of abortions performed in nonhospital facilities, by clients' source of payment, according to whether the facility is in a state that covers abortion under Medicaid, 2001 | |||
| Source of payment | All | State covers | State does not cover |
| (N=637) | (N=360) | (N=277) | |
| Self | 74 | 55 | 91 |
| Full fee | 62 | 43 | 79 |
| Reduced fee | 12 | 12 | 12 |
| Medicaid | 13 | 27 | <1 |
| Private insurance | 13 | 19 | 8 |
| Total | 100 | 100 | 100 |
| Notes: Percentages are weighted to represent women having abortions in nonhospital facilities. Ns are unweighted. | |||
![]()
| TABLE 4. Percentage distribution of nonhospital abortion providers, by selected early medical abortion protocols and experiences, according to medical abortion caseload in first half of 2001 | |||
| Protocols and experiences | Total (N=358) |
Caseload | |
| <50 (N=218) |
>=50 (N=140) | ||
| Minimum gestation | |||
| No minimum | 6 | 7 | 5 |
| Positive pregnancy test | 7 | 4 | 12 |
| Visible sac on sonogram | 9 | 9 | 10 |
| <28 days | 45 | 39 | 53 |
| >28 days | 33 | 41 | 20 |
| Maximum gestation | |||
| <7 weeks | 76 | 83 | 66 |
| 8 weeks | 12 | 10 | 14 |
| >=9 weeks | 12 | 8 | 19 |
| Mifepristone dosage used* | |||
| 200 mg | 83 | 76 | 93 |
| 600 mg | 15 | 21 | 7 |
| Other | 2 | 3 | 0 |
| Permits home administration of misoprostol | |||
| Yes | 84 | 78 | 93 |
| No | 16 | 22 | 7 |
| Counseling time required | |||
| More than for surgical abortion | 74 | 80 | 64 |
| The same as for surgical abortion | 24 | 19 | 32 |
| Less than for surgical abortion | 2 | 1 | 4 |
| % of clients who call with problems/questions | |||
| 0-4 | 23 | 24 | 21 |
| 5-9 | 20 | 16 | 25 |
| 10-19 | 24 | 21 | 28 |
| 20-100 | 34 | 39 | 26 |
| How pregnancy termination is confirmed† | |||
| By office visit | 91 | 93 | 88 |
| By other means | 3 | 2 | 4 |
| Not confirmed | 6 | 5 | 8 |
| Charge for mifepristone abortion* | |||
| $0-399 | 19 | 21 | 15 |
| $400-449 | 17 | 16 | 18 |
| $450-499 | 26 | 20 | 35 |
| >=$500 | 38 | 43 | 32 |
| Charge for mifepristone vs. surgical abortion at six weeks‡ | |||
| Mifepristone costs less | 9 | 14 | 3 |
| Both are the same | 21 | 22 | 18 |
| Mifepristone costs $1-99 more | 25 | 19 | 35 |
| Mifepristone costs $100-199 more | 29 | 29 | 30 |
| Mifepristone costs >=$200 more | 15 | 16 | 14 |
| Charge includes surgical completion when needed | |||
| Yes | 80 | 71 | 95 |
| No | 20 | 29 | 5 |
| Total | 100 | 100 | 100 |
| *Excludes providers who used only methotrexate. †Mean percentages. ‡Among those that provided both surgical and mifepristone abortions. Note: Significance tests were not conducted because this is a census, not a sample survey. | |||
![]()
| TABLE 5. Percentage of large nonhospital facilities that experienced any incidents of harassment, by type of harassment, according to year, 1985-2000; and percentage distribution of facilities, by number of incidents of harassment in 2000, according to type of harassment | ||||||||||
| Type of harassment | Year | No. of incidents in 2000 | ||||||||
| 1985 | 1988 | 1992 | 1996 | 2000 | 0 | 1-4 | 5-19 | >=20 | Total | |
| Picketing | 80 | 81 | 83 | 78 | 80 | 20 | 12 | 7 | 61 | 100 |
| Picketing plus physical contact with/blocking of patients | 47 | 46 | 50 | 32 | 28 | 72 | 19 | 4 | 5 | 100 |
| Vandalism* | 28 | 34 | 42 | 24 | 18 | 82 | 16 | 2 | 0 | 100 |
| Picketing of homes of staff | 16 | 17 | 28 | 18 | 14 | 86 | 11 | 1 | 1 | 100 |
| Bomb threats | 48 | 36 | 24 | 18 | 15 | 85 | 15 | <1 | 0 | 100 |
| *Jamming of locks or physical damage. Note: Large nonhospital facilities are those that provide 400 or more abortions per year. | ||||||||||
| |||||
| |||||
| © copyright 2003, The Alan Guttmacher Institute. |