| TABLE 1. Percentage distribution of panel survey respondents, by selected characteristics, Nepal, 1994 | ||
| Characteristic | % | |
| (N=1,442) | ||
| Ever attended school | ||
| Yes | 21.8 | |
| No | 78.2 | |
| Occupation | ||
| Agricultural | 75.4 | |
| Nonagricultural/unemployed | 24.6 | |
| Monthly household expenditure (rupees)† | ||
| <1,500 | 26.9 | |
| 1,501-3,000 | 54.9 | |
| 3,001-4,500 | 9.2 | |
| >=4,501 | 9.0 | |
| Age | ||
| <20 | 10.5 | |
| 21-25 | 19.7 | |
| 26-30 | 24.5 | |
| 31-35 | 18.7 | |
| 36-40 | 17.1 | |
| >=41 | 9.5 | |
| Ethnic group | ||
| Brahmin | 14.8 | |
| Chhetri | 18.2 | |
| Tharu | 20.0 | |
| Terai groups | 9.6 | |
| Tibetan-Burmese groups | 18.4 | |
| Newar | 4.6 | |
| Muslim | 5.0 | |
| Other | 9.4 | |
| Total | 100.0 | |
| †Percentages are based on responses from 1,367 women. In 2001, 75 rupees=US $1. | ||
![]()
| TABLE 2. Percentage of respondents reporting various types of spousal communication, by survey wave | |||
| Communication indicator | Wave one | Wave two | Wave three |
| Ever discussed family planning | 80.1 | 83.6 | 86.3 |
| Discussed family planning in the past year | 54.4 | 38.6 | 46.8 |
| Intends to discuss family planning† | 51.7 | 68.7 | 61.5 |
| Spouse approves of family planning | 80.9 | 82.4 | 86.9 |
| Knows no. of children spouse wants | 83.1 | 91.9 | 96.3 |
| †Percentages are based on responses from 1,442 women in wave one, 716 in wave two and 569 in wave three. The decline in the N over time presumably reflects that some women who intended to discuss family planning did so and therefore did not answer the question in later waves. Note: Wave one=1994; wave two=1997; wave three=1999. | |||
![]()
| TABLE 3. Odds ratios from logistic regression examining the effect of selected characteristics on spousal communication at wave three | |||||
| Characteristic | Ever discussed family planning | Discussed family planning in past year | Intends to discuss famiy planning | Spouse approves of family planning | Knows no. of children spouse wants |
| Communication index | |||||
| Wave one | 2.16*** | 1.49*** | 1.74 | 2.77*** | 2.95*** |
| Wave two | 1.40 | 1.20 | 1.50 | 1.62** | 1.61 |
| Occupation | 0.64* | 0.77 | 0.78 | 0.90 | 1.10 |
| Education | 2.07* | 0.87 | 1.44 | 1.63 | 2.59 |
| Age | 0.92*** | 0.90*** | 0.80*** | 0.99 | 0.95* |
| No. of children | 0.98 | 1.04 | 1.18 | 0.89* | 1.04 |
| Campaign exposure | |||||
| Wave two | 0.86 | 0.92 | 1.03 | 0.98 | 0.80 |
| Wave three | 1.86*** | 0.98 | 0.99 | 1.82*** | 1.79 |
| *p<.05. **p<.01. ***p<.001. Note: Wave one=1994; wave two=1997; wave three=1999. | |||||
![]()
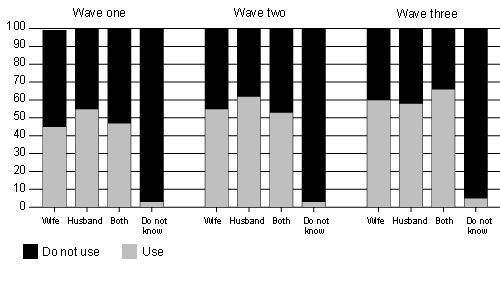
| FIGURE 1. Percentage distribution of respondents, by use of family planning at each survey wave, according to who makes family planning decisions |
 |
Notes: At each wave, differences according to who makes family planning decisions were statistically significant at p<.001. Wave one=1994, wave two=1997, wave three=1999. |
![]()
| TABLE 4. Odds ratios from two logistic regression models examining the effect of selected characteristics on contraceptive use at wave three | |||||
| Characteristic | Model one | Model two | |||
| Contraceptive use | |||||
| Wave two | 2.03*** | 2.00*** | |||
| Wave one | 7.35*** | 7.67*** | |||
| Communication index | |||||
| Wave three | 10.24*** | 6.83*** | |||
| Wave two | 1.31 | 1.24 | |||
| Wave one | 1.85** | 1.44 | |||
| Campaign exposure | |||||
| Wave three | 1.22 | 1.19 | |||
| Wave two | 1.06 | 1.07 | |||
| Wants no more children | 2.24*** | 3.20*** | |||
| Education | na | 1.57* | |||
| Age | na | 0.96*** | |||
| *p<.05. **p<.01. ***p<.001. Notes: Wave one=1994; wave two=1997; wave three=1999. na=not applicable. | |||||
![]()
| Appendix Table 1. Results of analyses of variance and chi-square tests indicating differences between study dropouts and panel participants, by selected characteristics | ||||||
| Characteristic | Final panel | Dropped out after wave one | Dropped out after wave two | Wave one vs. wave two† | Wave two vs. panel† | Wave one vs. panel† |
| (N=1,442) | (N=810) | (N=463) | ||||
| Education (yrs.) | 1.46 | 1.96 | 1.22 | 14.44*** | 2.22 | 12.04*** |
| Age | 30.31 | 29.68 | 32.34 | 23.44*** | 22.43*** | 3.05 |
| No. of children | 3.62 | 3.00 | 3.76 | 25.09*** | 1.18 | 36.36*** |
| Household expenditure (rupees) | 2,531.40 | 2,749.53 | 2,525.89 | 3.66 | 0.00 | 7.31** |
| Mean spousal communication score | 0.68 | 0.63 | 0.58 | 6.19* | 37.83*** | 15.34*** |
| % using family planning | 41.3 | 30.8 | 34.6 | 1.84 | 6.71** | 30.82*** |
| *p<.05.**p<.01.***p<.001.†F statistic for means, X2 for percentages. Note: Wave one=1994; wave two=1997. | ||||||
| © copyright 2002, the Alan Guttmacher Institute. |