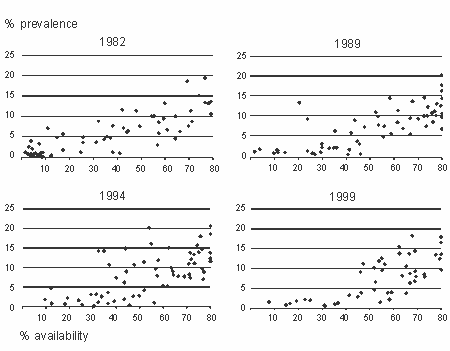
| FIGURE 1. Mean contraceptive prevalence of four methods, by mean availability, 1982-1999 |
 |
![]()
| FIGURE 2. Prevalence of use of four modern contraceptive methods (the pill, condom, IUD and female sterilization), by mean overall level of method availability and overall level of prevalence, 64 countries, 1994 or 1999 | |||||||||
| Mean availability | Mean prevalence | Mean prevalence (n=64) | |||||||
| Very low (N=16) | Low (N=16) | Medium (N=16) | High (N=16) | ||||||
| Country | % | Country | % | Country | % | Country | % | ||
| All | 6.2 | 22.4 | 39.5 | 58.6 | 31.7 | ||||
| Very low | Mean | 5.6 | Mean | 18.8 | Mean | 46.0 | Mean | 0.0 | 11.5 |
| Benin | 2.4 | Iraq* | 18.8 | Panama* | 46.0 | ||||
| Ethiopia | 2.8 | Guyana* | 46.0 | ||||||
| Niger | 3.2 | ||||||||
| Nigeria* | 3.6 | ||||||||
| Mali | 4.0 | ||||||||
| Madagascar | 4.8 | ||||||||
| Uganda | 5.2 | ||||||||
| Mauritania* | 5.6 | ||||||||
| Cameroon | 6.4 | ||||||||
| Sudan | 7.2 | ||||||||
| Malawi | 8.0 | ||||||||
| Tanzania | 8.8 | ||||||||
| Lesotho* | 10.4 | ||||||||
| Low | Mean | 8.8 | Mean | 18.9 | Mean | 40.8 | Mean | 59.6 | 32.2 |
| Haiti | 11.6 | Syria* | 23.6 | Jordan | 36.4 | Egypt | 47.6 | ||
| Senegal | 6.0 | Zambia | 13.2 | El Salvador | 44.8 | Cuba* | 80.8 | ||
| Nepal | 15.6 | Zimbabwe | 40.8 | Jamaica | 50.4 | ||||
| Kenya | 18.8 | Honduras | 38.4 | ||||||
| Guatemala | 26.4 | Ecuador | 44.4 | ||||||
| Pakistan | 15.6 | ||||||||
| Medium | Mean | 8.8 | Mean | 20.8 | Mean | 37.2 | Mean | 58.4 | 39.5 |
| Ghana | 8.8 | Bolivia | 16.0 | Iran* | 39.2 | Kuwait* | 48.4 | ||
| Oman | 15.2 | India | 32.8 | Costa Rica | 62.0 | ||||
| Philippines | 25.6 | Morocco | 42.4 | Vietnam | 55.2 | ||||
| Indonesia | 27.2 | Turkey | 35.2 | Rep. of Korea | 55.2 | ||||
| Sri Lanka | 37.2 | China | 73.2 | ||||||
| Dom. Rep. | 57.6 | ||||||||
| High | Mean | 0.0 | Mean | 28.4 | Mean | 37.2 | Mean | 58.1 | 43.6 |
| Peru | 32.0 | Mauritius* | 35.2 | Colombia | 54.0 | ||||
| Malaysia* | 24.0 | Paraguay | 34.4 | Thailand | 50.0 | ||||
| Bangladesh | 32.0 | Algeria | 38.8 | Brazil | 66.4 | ||||
| Trinidad & Tobago* | 31.2 | Venezuela* | 40.0 | Mexico | 54.4 | ||||
| Botswana* | 22.8 | Singapore* | 62.8 | ||||||
| Taiwan | 72.0 | ||||||||
| Tunisia* | 46.8 | ||||||||
| *Data are for 1994. | |||||||||
![]()
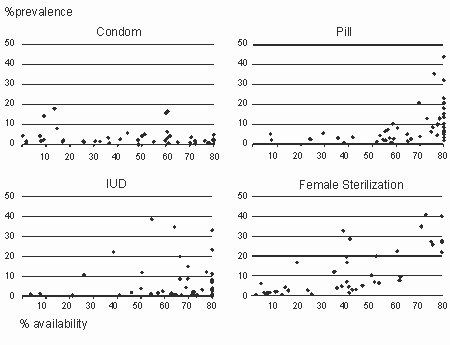
| FIGURE 3. Contraceptive prevalence, by availability, according to method, 47 countries, 1999 |
 |
![]()
| TABLE 1. Mean contraceptive prevalence in 64 countries, by mean availability and year, according to standard deviation of availability | ||||
| Mean availability and year | Standard deviation | |||
| High | Low | |||
| Mean prev. | No. of countries | Mean prev. | No. of countries | |
| High | ||||
| 1982 | 8.3 | 23 | 10.9 | 9 |
| 1989 | 9.3 | 10 | 11.5 | 22 |
| 1994 | 9.1 | 9 | 11.8 | 23 |
| Low | ||||
| 1982 | 4.0 | 9 | 1.9 | 23 |
| 1989 | 4.1 | 22 | 2.3 | 10 |
| 1994 | 6.2 | 23 | 3.6 | 9 |
| Note: Data pertain to only four methods--female sterilization, the IUD, the pill and the condom. | ||||
![]()
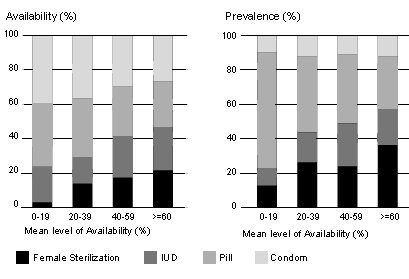
| FIGURE 4. Percentage distribution of contraceptive availability and prevalence, by method, according to mean level of availability, 1994 |
 |
![]()
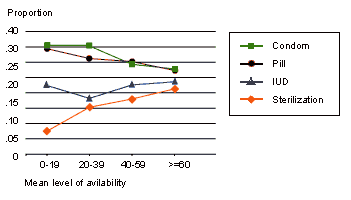
| FIGURE 5. Proportion of total contraceptive prevalence accounted for by each method, by mean level of availability |
 |
Note: Values shown are averages of 1982, 1989 and 1994 data. |
| © copyright 2002, the Alan Guttmacher Institute. |