
View the most recent estimates and analysis on this topic here.
Introduction
Survey-based measures of "unintended pregnancy" have been used as important indicators of the public health of a population, and reducing the incidence of unintended pregnancy to improve the health of the nation has long been a goal for both federal agencies and public health advocates.1 In addition, numerous studies have shed light on the effects of unintended pregnancies on the lives of individuals and their families.2–8 The Guttmacher Institute has published periodic estimates of unintended pregnancy rates for individual states, which has allowed for comparisons of experiences across states, and may provide insight into state-level influences on health behaviors, outcomes and access that are not evident in a single, national-level measure. The current report breaks from the prior series, describing pregnancy at the state level using new categories of pregnancy desires, including new measures of uncertainty.
New measures of pregnancy desires
This report provides estimates for 2014 of the numbers and rates of pregnancies separated into three groups: pregnancies to individuals who reported that they either did not want to become pregnant at all or wanted to become pregnant later than the time the pregnancy occurred; to those who reported that they wanted to become pregnant then or sooner; and to those who reported that prior to their pregnancy they had not been sure whether they wanted to become pregnant.
Our measures of pregnancy desire come from two sources: the Guttmacher Institute’s 2014 U.S. Abortion Patient Survey (APS), for pregnancies ending in abortion, and the annual Pregnancy Risk Assessment Monitoring System (PRAMS) surveys, a surveillance project conducted by the Centers for Disease Control and Prevention (CDC) and individual states, for the year 2014, for pregnancies ending in live births. PRAMS changed their measure of pregnancy desire beginning in 2012 by adding a new response category. The question prior to 2012 was, "Thinking back to just before you got pregnant with your new baby, how did you feel about becoming pregnant?" Response categories were "I wanted to be pregnant sooner," "I wanted to be pregnant later," "I wanted to be pregnant then" and "I didn’t want to be pregnant then or at any time in the future"; in 2012, the new response option, "I wasn’t sure what I wanted," was added.* This new answer option enables us to examine, for the first time at the state level, the prevalence of feelings of ambivalence or uncertainty toward becoming pregnant.
In addition to numbers and rates of pregnancy, we also present percentage distributions of births by reported pregnancy desires and of pregnancies by outcome among women† aged 15–44 residing in each U.S. state and the District of Columbia. As will be discussed in the Data Sources and Methods Appendix and detailed in Maddow-Zimet and Kost, estimates presented in previous reports are not comparable to those we present here.9 Instead, these 2014 estimates establish the baseline: the first set of statistics on pregnancy at the state level comparable across all 50 states and the District of Columbia using new measures of pregnancy desires.
The estimates presented in this report are also not comparable to national-level estimates previously published.10 Not only are the questions used to elicit responses slightly different between the state-level and national-level surveys, but the answer options presented to respondents differ as well (see Data Sources and Methods Appendix). For these reasons, it is not advisable to compare estimates from this report to current, national-level estimates of "unintended" pregnancy.
Note on language
Researchers (and prior published Guttmacher reports in this series) typically refer to the "intention status" of pregnancies, and use the term "intended" to refer to pregnancies that occurred to respondents who recalled having wanted to get pregnant just before it happened (wanted then) or had wanted to become pregnant sooner than it occurred (wanted sooner). However, the survey questions in PRAMS that have been used to assign pregnancy intention status do not ask respondents whether they intended to become pregnant; they ask whether they had wanted to become pregnant. The question is not designed to measure intentionality or some degree of planning; the use of the terms "intended" and "unintended" contributes to this confusion. Some of the respondents categorized as having intended pregnancies may have planned on becoming pregnant, but others may not have. "Unintended" pregnancies are identified as those that occurred when a respondent reported they had wanted to become pregnant later (typically referred to as "mistimed" pregnancies) or had not wanted to become pregnant at all ("unwanted"). Even use of the term "mistimed" is a leap from what was reported; respondents may not have attempted to plan the timing of their pregnancy, and only those whose pregnancies were mistimed in one direction are included in this category: those that would have preferred the pregnancy to have occurred later than it did.
In this report, we have chosen to shift toward more accurate language to describe what has been measured. Instead of using the traditional intention categories, we refer when possible to the actual response categories individuals selected from those presented to them. Whether the available response options are sufficient to accurately characterize pregnancy and childbearing attitudes is still an open question and deserving of further research. In these analyses, we are constrained by the categories used in current surveys.
In several instances, we combine response categories in ways that mirror prior analyses. We combine the wanted then and wanted sooner categories ("wanted then or sooner"), which is similar to prior analyses that combined these two groups to create the "intended" group. In some cases, we also combine the "wanted later" and "unwanted" pregnancies to form one group of pregnancies that had not been desired just before they occurred ("wanted later or unwanted"). However, we refrain from referring to this combined group as "unintended pregnancies." As discussed further in the Data Sources and Methods Appendix, a question change that includes the addition of new response options means that the proportion choosing each of the older answer options is likely to shift. Thus, comparisons of wanted-later-or-unwanted pregnancy rates from this report to unintended pregnancy rates from prior reports would be misleading as the two rates are not comparable.9
Finally, the new answer option—"I wasn’t sure what I wanted"—is not grouped with either the wanted-then-or-sooner or the wanted-later-or-unwanted categories, but presented separately, to examine pregnancy among people for whom this third category of desire may more closely align with a previously unacknowledged set of feelings prior to pregnancy. In summary, our analysis will focus primarily on the three following broad categories of pregnancy desires: wanted then or sooner, wanted later or unwanted, and wasn’t sure, with further breakdowns for the first two categories where the data allow.
Key Findings
Pregnancy in the states
Table 1 presents estimates for 2014 of numbers of pregnancies, pregnancy rates, the proportion of pregnancies wanted later or unwanted, and the percentage distribution of wanted-later-or-unwanted pregnancies by outcome for residents of each state. Pregnancies include births, abortions and fetal losses.
- As expected, states with the largest populations had the largest number of pregnancies in 2014. California had the largest number of pregnancies (763,880), followed by Texas (534,000) and New York (410,420). States with the fewest pregnancies were Vermont (8,720), Wyoming (10,020) and North Dakota (14,520).
- Similarly, states with the largest populations had the largest number of births in 2014. California had the largest number of births (494,800), followed by Texas (393,302) and New York (234,232). States with the fewest births were Vermont (6,003), Wyoming (7,569) and Rhode Island (10,640).
- The size of the state’s population of women does not always dictate the number of abortions. While the largest number of abortions were obtained by individuals residing in two states with large populations—California and New York (154,660 and 117,580, respectively)—there were more abortions to residents of Florida (72,630) than to residents of Texas (56,400), even though the population of women of reproductive age is approximately one and a half times larger in Texas than in Florida.
- In 18 of the 50 states, more than 40% of pregnancies in 2014 were wanted later or were unwanted. The proportion of pregnancies that were wanted later or were unwanted ranged from 26% in Utah to 48% in Delaware and Florida.
- The highest wanted-then-or-sooner pregnancy rates were in Utah (62), and Alaska, Idaho and Nebraska (52); the lowest rates were in Mississippi and South Carolina (34), and Alabama and Tennessee (35).
- The highest wanted-later-or-unwanted pregnancy rates were in New York (48), New Jersey (46), and Delaware, Florida and Maryland (44); the lowest rates were in Wisconsin (24), and Utah and Vermont (26).
- Wanted-later-or-unwanted pregnancy rates were generally higher in the South and Southwest (Florida, Louisiana, Mississippi, Nevada, Tennessee, Texas), and in densely populated states (Delaware, Maryland, New Jersey, New York).
- In two states, as many as 17 pregnancies per 1,000 women aged 15–44 were characterized as having occurred when individuals were not sure they had wanted to become pregnant (New Mexico and North Dakota). For most other states, the wasn’t-sure rate ranged from seven to 15 per 1,000 women aged 15–44.
- Pregnancies can end in a birth, abortion or fetal loss (miscarriage or stillbirth). In 30 states, more than half of pregnancies that were wanted later than they occurred or were unwanted resulted in a birth.
Distribution of births by reported desires prior to pregnancy
Table 2 shows the distribution of births for 2014 according to reported pregnancy desires. It is important to emphasize that findings from this table report on births only, not all pregnancies; in addition, estimates are available only for those states with PRAMS data on births, as well as California, which has a similar, though not identical, measure of pregnancy desire. There are currently no state-level, representative data on pregnancy desires among individuals having abortions for all, or even a majority, of states.‡
- In the 39 states with comparable data available, and among individuals with pregnancies leading to a birth, more reported having wanted to become pregnant at the time of their pregnancy, or reported having wanted to become pregnant sooner, than reported their pregnancy as having occurred too soon or as unwanted. The percentage reporting that the pregnancy leading to birth was wanted then or sooner ranged from 44% in Louisiana to 67% in Massachusetts.
- In all states, the majority of pregnancies leading to births that were characterized as having occurred at the right time or sooner comprised those that had been wanted at the time they occurred (65–87%).
- The proportion of births reported as having resulted from pregnancies wanted later or not at all ranged from 21% in Vermont to 39% in Louisiana.
- In all states, the majority of births from pregnancies that were wanted later or were unwanted were those for which individuals said they had wanted to become pregnant later (70–86%).
- In all states, a substantial proportion of respondents recalled that they had not been sure about what they had wanted prior to the pregnancy that resulted in a birth. The proportion reporting this characterization of their pregnancy ranged from 10% to 22%, although 32 of the 39 states had proportions falling in a narrower range of 12–19%.
Discussion
This report documents our best estimates of statistics on pregnancy and births at the state level, according to new measures of pregnancy desire and using the most recent and currently available data. This report is intended as a descriptive presentation of estimates. We limit our interpretation of the findings, but in this section, we further highlight some patterns from the 2014 data.
There is considerable variation in desires for pregnancy across the United States. Pregnancies that occurred when individuals had wanted to delay childbearing or had not wanted to become pregnant at all were common, ranging from more than one-quarter to almost one-half of all pregnancies across the states. Among pregnancies that did not fall into these two categories, not all were reported as wanted at the time they occurred. Some had been wanted sooner than they occurred, and a substantial proportion of pregnancies in all states occurred when individuals had not been sure about whether they had wanted to become pregnant.
In this report, we combine pregnancies that individuals reported they had wanted at the time they happened ("wanted then") with those they reported as having occurred later than they had wanted ("wanted sooner"). This is consistent with the combination of these two response categories in the conceptualization of "intended" pregnancy most often used in research on pregnancy intentions. However, we also present the two categorizations separately when we are able to do so, because they are not equivalent measures of pregnancy desire, particularly with regard to preferences for the timing of the pregnancy. When looking at the distribution of these two categories of pregnancy desire among births, there is considerable variation across states in the relative proportion of those who characterized their pregnancy as one they had wanted to happen at the time it occurred and those who would have preferred it had happened sooner.
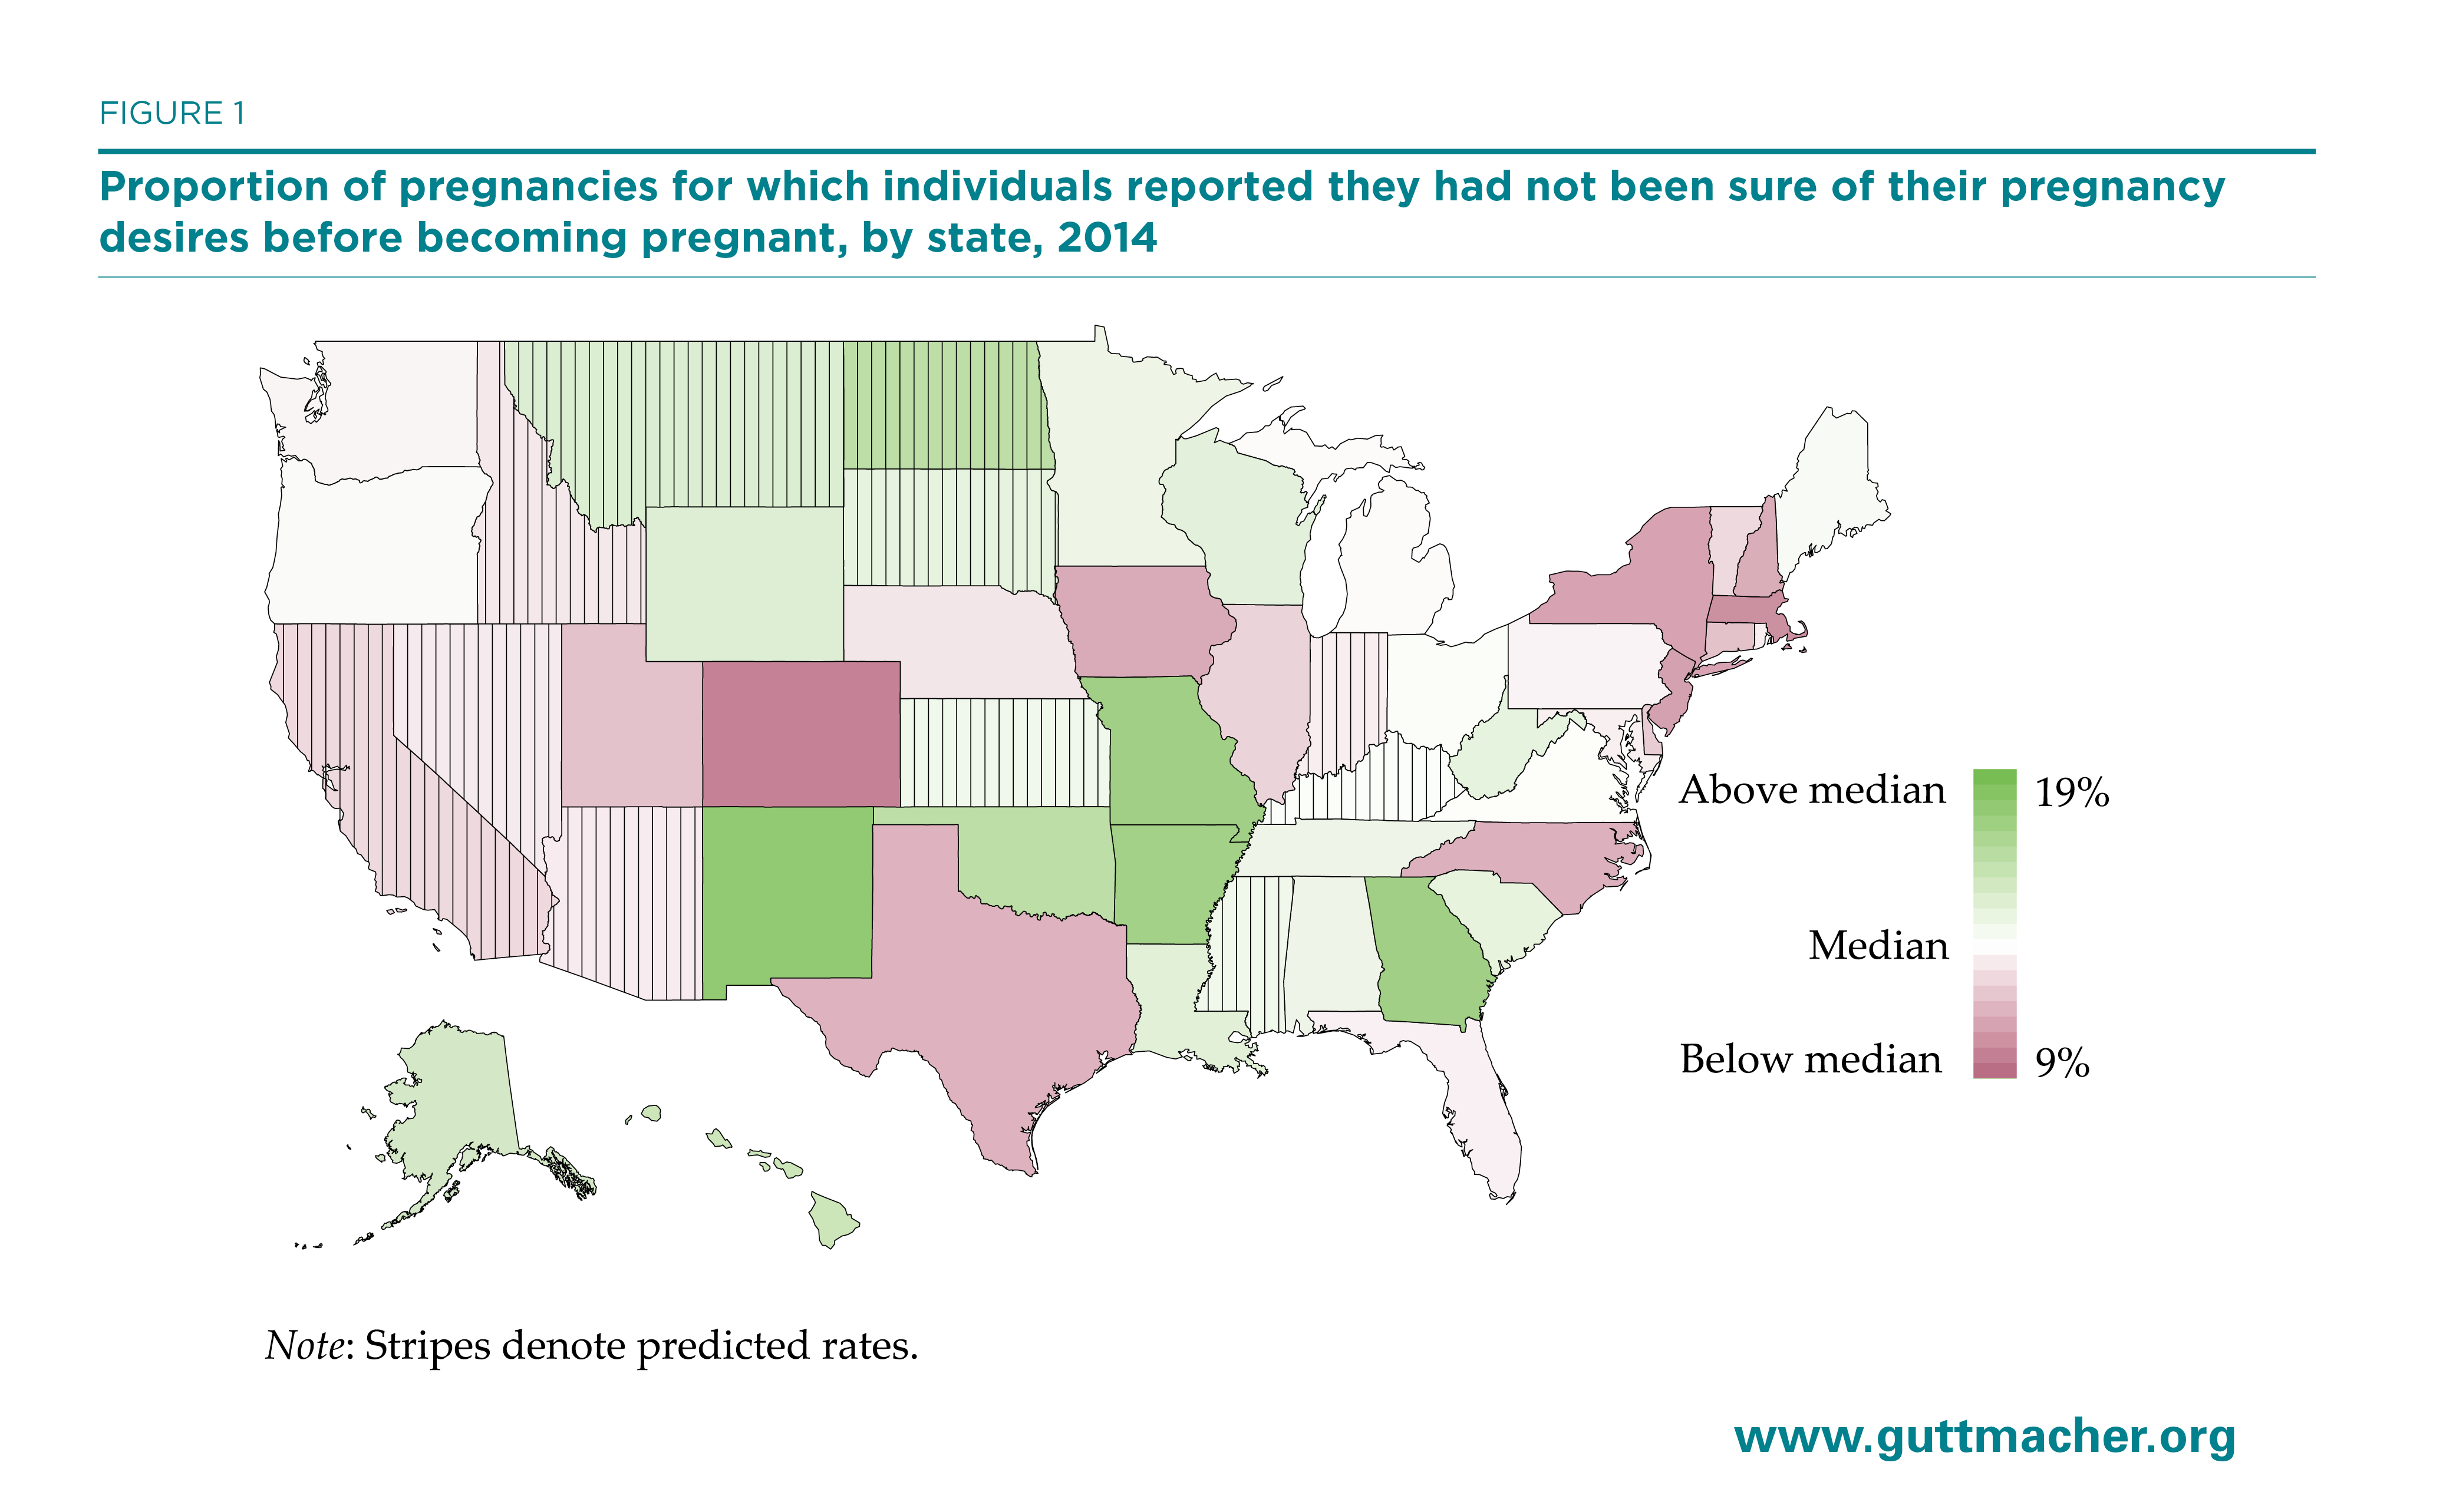
We also present, for the first time, the number of pregnancies at the state level to individuals who had been unsure about their pregnancy desires. As shown in Figure 1, the states’ proportions of pregnancies reported to have occurred when an individual was unsure about whether they had wanted to become pregnant ranged from 9% to 19%. There is no clear pattern in states for which residents reported higher or lower proportions of uncertainty. Many factors could affect these proportions, including demographic ones (such as the age distribution of people who become pregnant) or sociocultural ones (such as norms around pregnancy planning). Individuals may also express uncertainty or ambivalence toward pregnancy because of the complicated contexts in which many pregnancies occur, in which desire (or lack of desire) for pregnancy may conflict with economic realities or partner desires.11
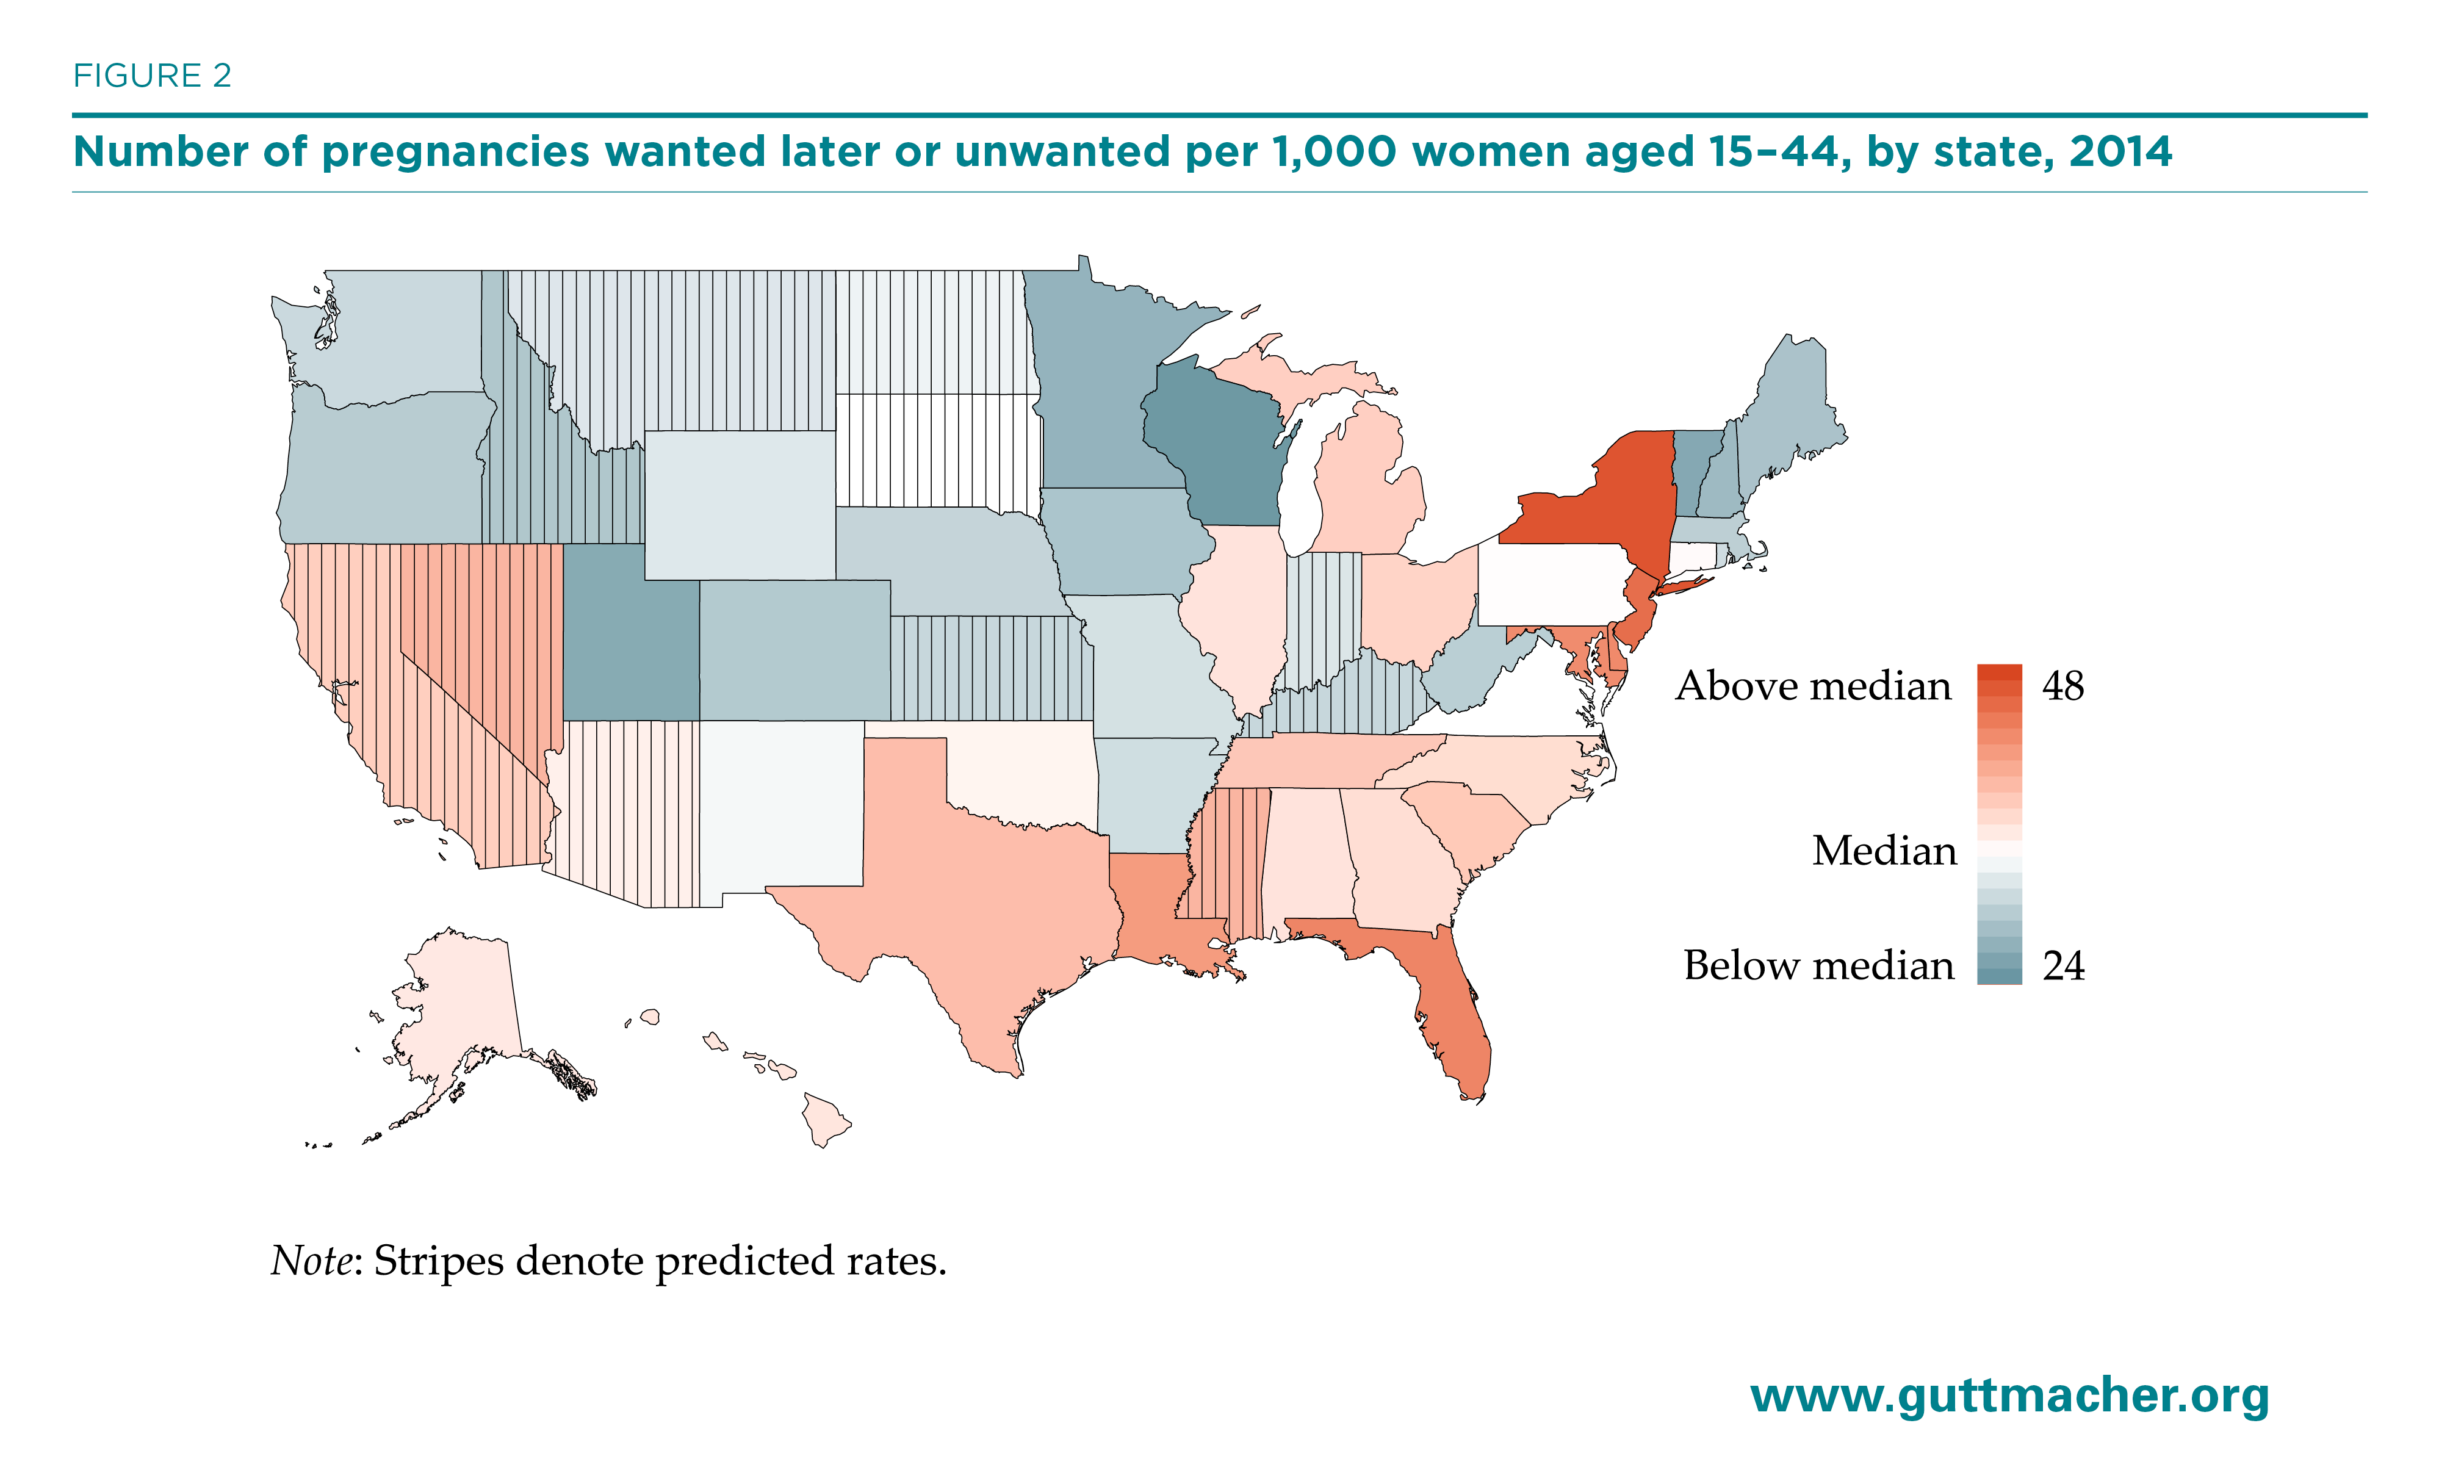
The wanted-later-or-unwanted pregnancy rate for each state is shown in Figure 2. These rates represent the number of pregnancies wanted later or unwanted for every 1,000 women aged 15–44; the highest rate of 48 means that for every 1,000 women aged 15–44, 48 individuals (or 4.8%) had a pregnancy that was wanted later or unwanted in 2014. One way of thinking about this rate is by relating it to other common experiences that people have—for example, every year, approximately 31 out of 1,000 people aged 15–44 will move out of the state in which they are currently living.12 Rates above the median are most common in the South, in densely populated states and in states with large urban populations (e.g., California, New York, Texas). Many states also had wanted-later-or-unwanted pregnancy rates below the median value, particularly those in the Northwest, Midwest and New England. It is likely that many factors contribute to the variation in these rates (as well as others included in this report), including demographic characteristics of the population at risk of pregnancies wanted later or not at all, and political and health care climates that support or hinder access to the full range of contraceptive methods available.
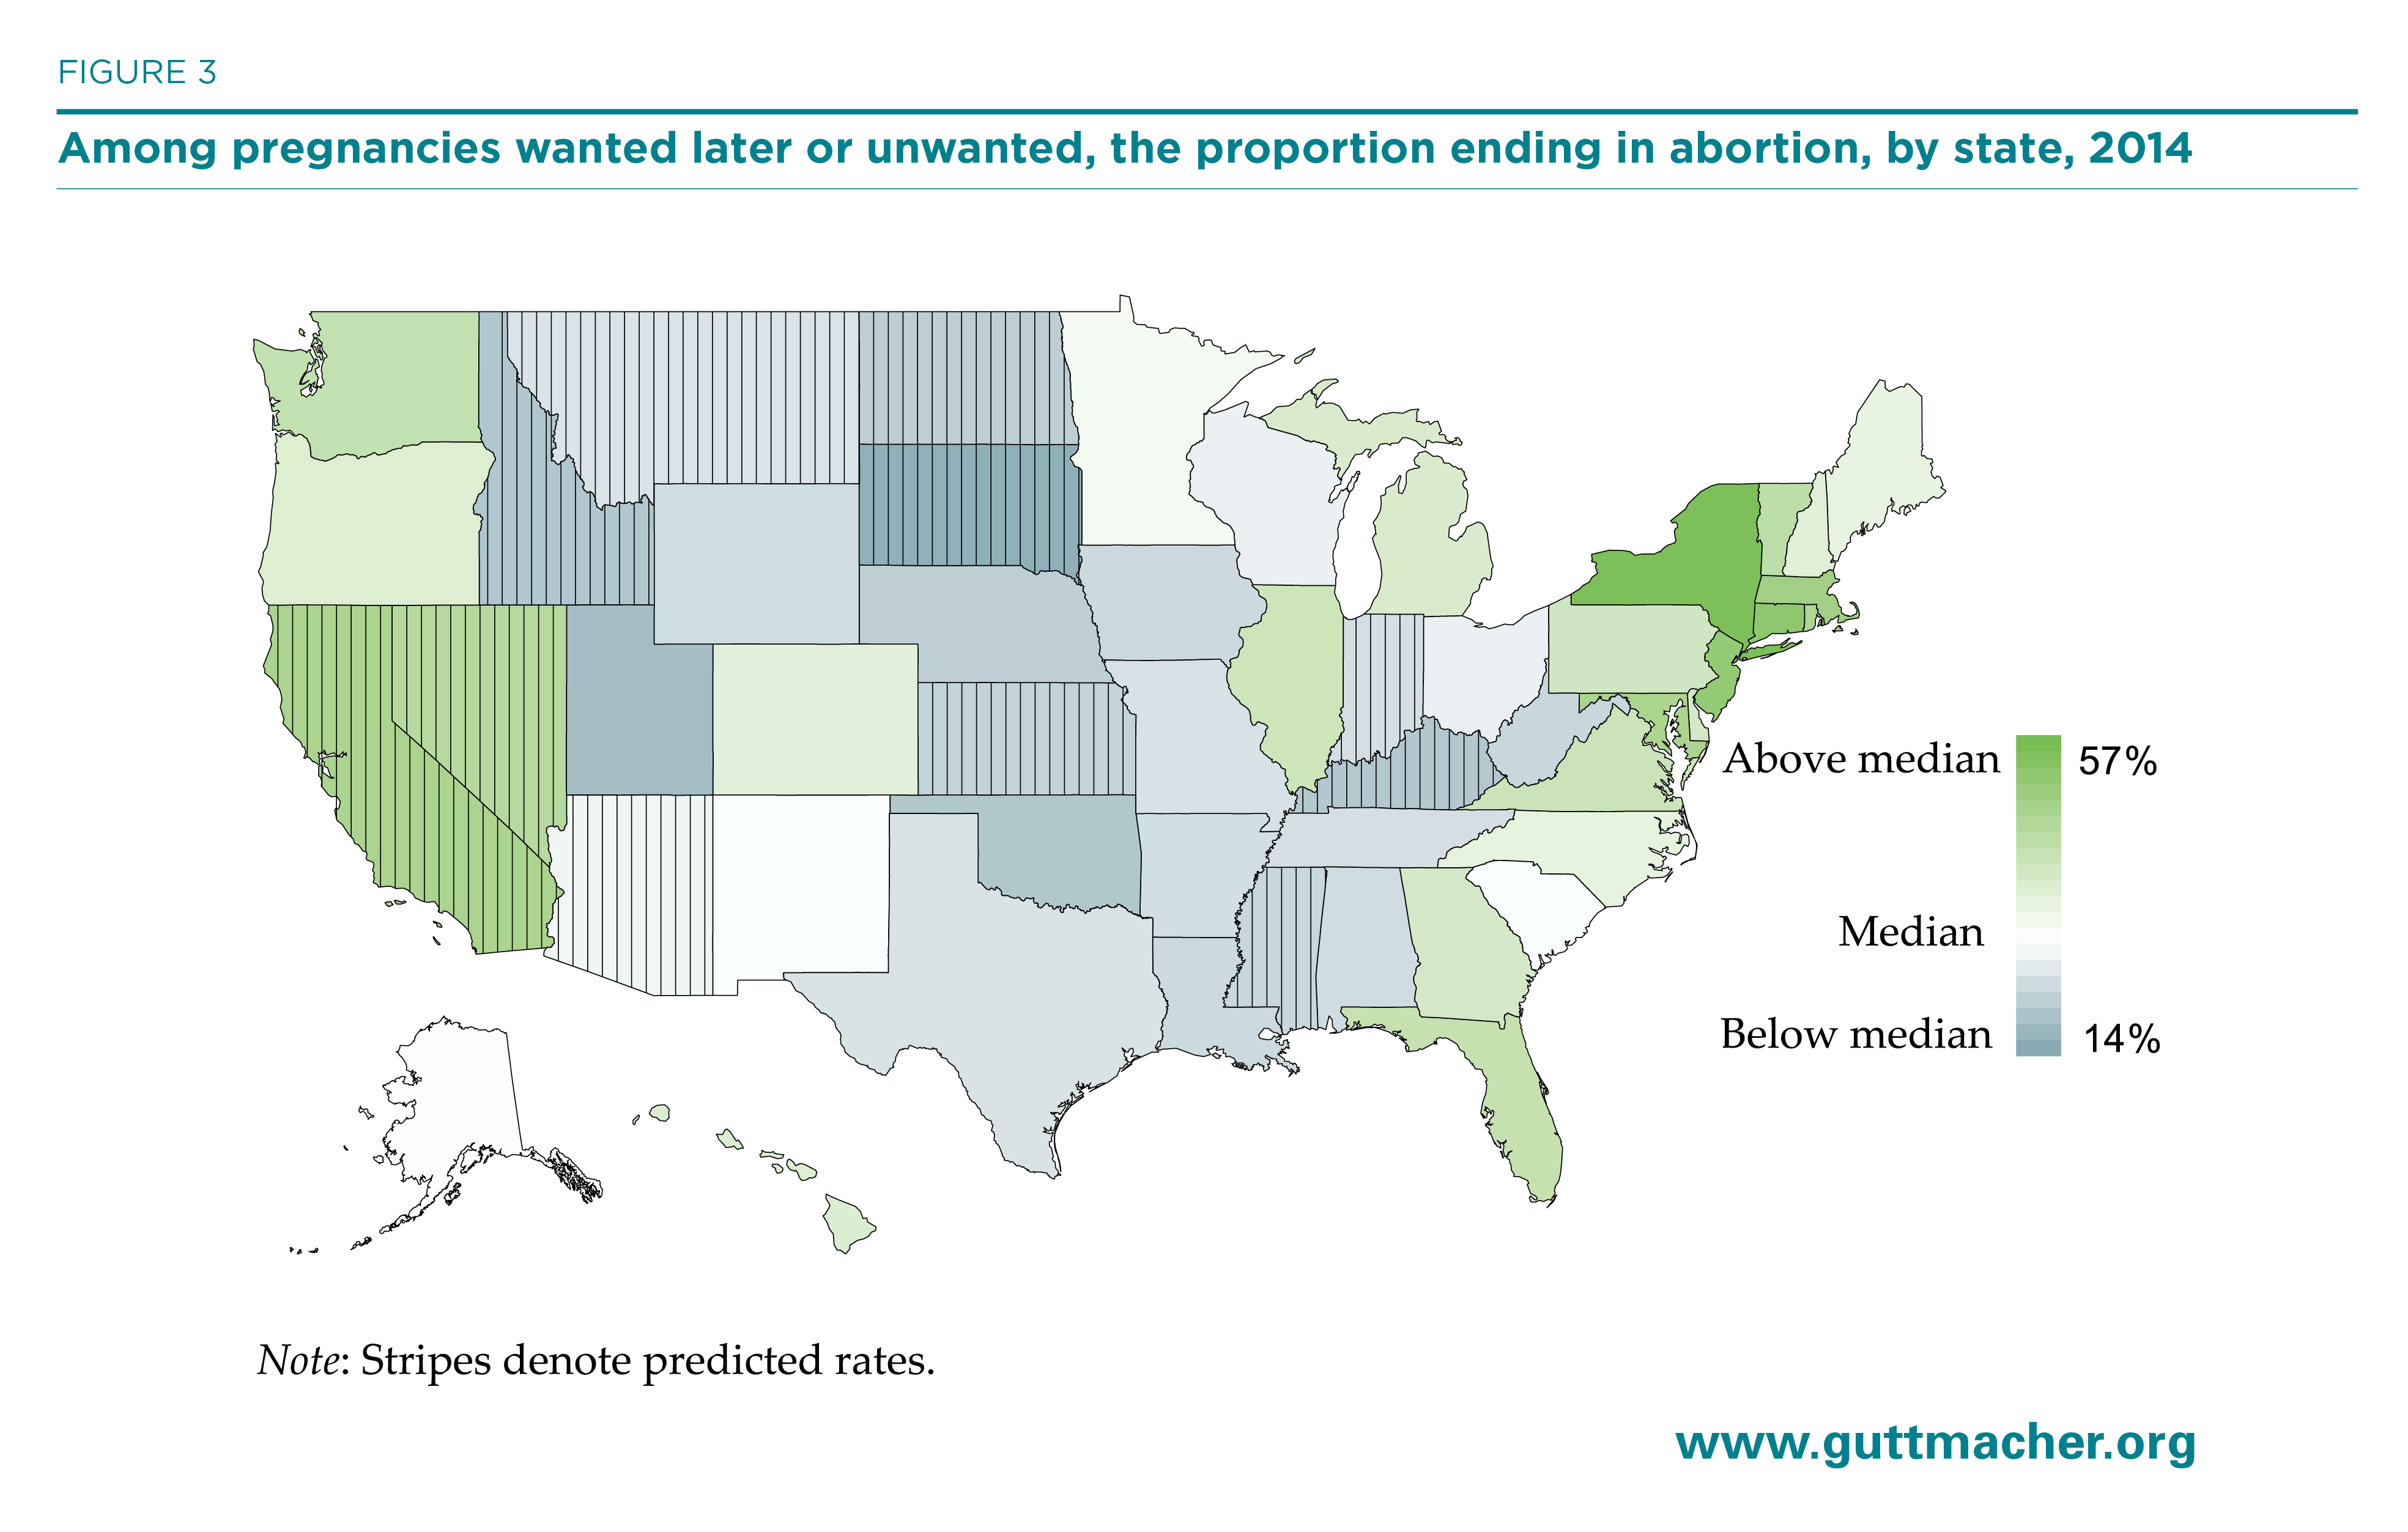
It is important to remember that pregnancies are not equivalent to births, and that not all pregnancies that occurred too soon or were unwanted result in a birth. Figure 3 shows the proportion of these pregnancies that end in an induced abortion across the states. Proportions tend to be higher than the median in states along the eastern seaboard (including some southern states) and the West Coast, while proportions are somewhat lower in states in the Midwest and western United States. Accessibility of abortion services may play some role in this variation, given that high wanted-later-or-unwanted pregnancy rates (Figure 2) do not always result in higher proportions of pregnancies wanted later or unwanted that ended in abortion (Figure 3).
This report presents a new set of pregnancy rates calculated with revised pregnancy desire measures. As noted above, this means that these estimates are not comparable to state-level pregnancy estimates by pregnancy desire calculated using older data. In particular, state-level estimates of pregnancies that had been wanted later or unwanted based on the 2014 PRAMS surveys are likely to be lower than unintended pregnancy rates from prior years. For many states, the proportion of births resulting from pregnancies wanted later or unwanted will appear to have declined when compared with estimates calculated with data prior to 2012, but the decrease may be entirely attributable to the addition of the new answer option for the pregnancy desire question on the PRAMS surveys.9 Thus, we recommend that ongoing surveillance of pregnancy intentions at the state level should use these 2014 estimates as the baseline for tracking trends going forward.
This report is primarily descriptive; more research is needed on the drivers of variation in rates and proportions of pregnancies characterized by different prepregnancy desires at the state level. State and local contexts likely have some level of influence on both pregnancy desires and on whether individuals are successfully able to achieve those desires; more research in this area could potentially inform policies that would better help individuals both prevent pregnancies when they do not want to become pregnant, and achieve pregnancy when they want to.
Data Sources and Methods Appendix
The total number of pregnancies in each state is the sum of all births, abortions and fetal losses to residents of that state. Similarly, the total number of pregnancies wanted later or unwanted is the sum of all births from pregnancies wanted later or unwanted, all abortions from pregnancies wanted later or unwanted and all fetal losses from pregnancies wanted later or unwanted. The data sources for births, abortions and fetal losses, and distributions of pregnancy desires for each are described below, as well as the methods we employed for calculations.
Births: counts and pregnancy desires
The annual number of births occurring to residents of each state was obtained from the U.S. vital statistics system for 2014.13 The numbers of births included in our tables and calculations are adjusted to include only one birth from deliveries with multiple births. This is to ensure that estimates of the incidence of pregnancy are not counted twice for the same individual.
•PRAMS data. For most states, the proportion of births categorized into each pregnancy desire group was obtained from the 2014 PRAMS. PRAMS consists of annual surveys of residents who have delivered a recent live birth (respondents are typically surveyed 2–6 months after delivery). The sample is drawn from the state vital statistics data file containing all birth certificates and is weighted to represent those who reside in the state and delivered a live birth in the year of the survey. PRAMS surveys are coordinated by the CDC and were conducted in 40 states in 2014.14,15 In addition, PRAMS has been conducted annually in New York City since 2001.§
For data collected in 2014, the CDC did not recommend the use of or release data from PRAMS surveys that did not reach a response rate of 60%.15 Estimates from surveys with lower-than-optimal response rates can be greatly affected by unobserved variation in who is likely to respond; in addition, data from these surveys typically have smaller sample sizes, and thus greater sampling error. We used estimates of the pregnancy desires of births from surveys falling below the threshold when there were no other data available; uncertainty intervals (the calculation of which are described in more detail below) around rates calculated from these surveys reflect their greater sampling error, but not other potential sources of nonresponse bias.**
Estimates used in this report from states with weighted survey response rates of less than 60% in 2014 were Arkansas (58%), Colorado (59%), Florida (48%), Georgia (47%), Louisiana (59%), Michigan (57%), Minnesota (54%), North Carolina (55%), Oregon (57%), South Carolina (50%), Texas (53%) and Virginia (49%).
For each state with available and comparable data, we obtained weighted proportions of births falling into each of the pregnancy desire response categories. These proportions were applied to the state’s total number of births reported in U.S. vital statistics for 2014. We were able to directly calculate 2014 estimates for 39 states.††
•States without PRAMS surveys. For the twelve jurisdictions where PRAMS or similar data were not available (Arizona, District of Columbia, Indiana, Kansas, Kentucky, Mississippi, Montana, Nevada, North Dakota and South Dakota), or the pregnancy intention question used on surveys in those states differed from PRAMS (California and Idaho), we predicted pregnancy rates according to desire status using Bayesian multivariable linear regression models. In the models, each of the 39 states with data represented an observation. In the first model, the dependent variable was the state wanted-later-or-unwanted pregnancy rate; in the second, the dependent variable was the wanted-then-or-sooner pregnancy rate. The remaining estimate—the wasn’t-sure rate—was then obtained by subtracting the wanted-later-or-unwanted and wanted-then-or-sooner pregnancy rates from the total pregnancy rate for residents in each predicted state. In all models, we included a set of independent variables that were based on demographic characteristics shown to be associated with pregnancy desires.6,16–21 Model selection was carried out using leave-one-out cross-validation (described in more detail below); our final model included age, race and ethnicity, and marital status, using a regularized horseshoe prior on the covariates to limit the risk of overfitting our model to the available data.22 Finally, we included the state’s overall pregnancy rate as a key independent variable. The adjusted Bayesian R2 values23 of the final models were 0.83 (for model predicting wanted-later-or-unwanted pregnancy), and 0.82 (for wanted-then-or-sooner model). Those states with predicted rates are indicated as such in the tables.
To test the accuracy of the model, we calculated predicted rates for the 39 states for which we had data, dropping that state’s data from the model before prediction. We then compared the model’s prediction to the actual rate for that state. Twenty-three of 39 predicted rates were within two points of the actual rate, and another fourteen were within four points. The largest differences between predicted and actual rates were five points for Wisconsin and four points for Tennessee; in Wisconsin, the predicted rate was higher than the actual rate, whereas the opposite was true for Tennessee. There was no clear geographic pattern to the size of these residuals.
•Comparability of measures over time. In a detailed investigation of the potential impact of the question change on participant’s responses, Maddow-Zimet and Kost concluded that estimates of unintended pregnancy using the new measure were not comparable to those produced using the prior question and should not be used to track trends over the period of time straddling the old and new questions on the PRAMS surveys.9 Thus, new state-level estimates of pregnancies that are wanted later or unwanted presented in this report are not comparable to the unintended pregnancy rates presented in our prior publications, which documented trends from 2002 to 2010.24–26
Abortions: counts and pregnancy desires
For abortion counts, most but not all states conduct annual surveillance of abortions provided in the state.27 However, abortions are almost always underreported to state surveillance systems.27,28 In addition, for the calculation of state-specific pregnancy rates, abortion counts need to be according to the individual’s state of residence (not where the abortion occurred). We therefore used counts of abortions by state of residence for 2014 estimated from a periodic national census of abortion providers and ancillary surveys of clinics conducted by the Guttmacher Institute, in conjunction with data on the state of residence of individuals having abortions in each state from the CDC and state-level health departments.29
There are currently no representative state-level data that allow for categorizing pregnancy desires among individuals whose pregnancies resulted in induced abortion (PRAMS is limited to births). However, we do have national-level estimates of pregnancy desires prior to pregnancies ending in induced abortion from a nationally representative sample interviewed in the Guttmacher Institute’s 2014 APS. Although a majority of abortions result from wanted-later-or-unwanted conceptions, some individuals do obtain abortions following a conception that was categorized as having occurred at the right time or later than desired (the "wanted then or sooner" groups).‡‡30 Data on pregnancy desires among those whose pregnancies resulted in induced abortion are also available from the National Survey of Family Growth, but abortions are substantially underreported in that survey, which raises serious concerns about the representativeness of the abortions that are reported; in addition, these estimates are also only available at the national level.31,32 Because the proportion of abortions following wanted-then-or-sooner pregnancies in the APS is quite small (approximately 5%), we are comfortable applying the national distribution by pregnancy desire to the number of abortions that occurred among residents of each state to obtain the number of pregnancies wanted later or not wanted at all that ended in abortion in that state.
Fetal losses: counts and pregnancy desires
Fetal losses are often included in vital statistics reports, but they are even more undercounted than induced abortions because, for most states, only fetal deaths occurring at 20 weeks’ gestation or later are required to be reported to the vital statistics system. Also, fetal loss is likely to be underreported in surveys of pregnancy histories because many spontaneous abortions occur at very early gestations and are not detected.31 A reasonable approximation of the total number of fetal losses is the sum of 20% of all births and 10% of all induced abortions.§§33 We applied this approximation separately for wanted-then-or-sooner, wanted-later-or-unwanted and wasn’t-sure pregnancies. For example, we calculated wanted-later-or-unwanted pregnancies ending in fetal loss for each state as the sum of 20% of wanted-later-or-unwanted pregnancies ending in births and 10% of wanted-later-or-unwanted pregnancies ending in abortion to obtain the number of wanted-later-or-unwanted pregnancies ending in fetal loss in each state.
Numbers of pregnancies and percentage wanted later or unwanted
To obtain the proportion of all pregnancies that were wanted later or unwanted, we simply divided the number of wanted-later-or-unwanted pregnancies by the total number of pregnancies. For those states with wanted-later-or-unwanted pregnancy rates predicted from the regression model, we applied each predicted rate to the state’s population count of women aged 15–44 in 2014 to calculate the number of wanted-later-or-unwanted pregnancies and the percentage of pregnancies that were wanted later or unwanted.
For states with wanted-later-or-unwanted pregnancy rates predicted from multivariable regression, we calculated the number of wanted-later-or-unwanted pregnancies ending in birth by subtracting wanted-later-or-unwanted pregnancies ending in abortion and fetal loss from the calculated total number of pregnancies wanted later or unwanted. To estimate wanted-later-or-unwanted pregnancies ending in fetal loss for these predicted states, we assumed the proportion of fetal losses that were wanted later or unwanted was the same as the proportion of pregnancies that were wanted later or unwanted.
Population data
The accuracy of demographic rates depends on having accurate counts of the population. It is important to note that because the sampling frames for PRAMS and for the APS are based on birth certificates and abortion patients, respectively, they include the population of transgender men and nonbinary people who gave birth or had abortions in 2014. Ideally, our denominator should include all people who are able to get pregnant and deliver a live birth—which would include some unknown proportion of women, some proportion of transgender men and some proportion of nonbinary people. Because there are no reliable estimates of the population of people who are able to get pregnant, we use as a proxy the number of women of reproductive age (15–44) as measured by the Bureau of the Census. All rates in this report are calculated as events per 1,000 women aged 15–44 residing in the state. Following the decennial census, population counts for women residing in each state in 2014 are produced by the Bureau of the Census in collaboration with the National Center for Health Statistics for July 1 of each year and revised periodically (the "vintage"). We used the Vintage 2016 estimates of bridged-race postcensal population estimates for 2014.34
Uncertainty intervals
The data sources we use to estimate the proportion of births and abortions in each pregnancy desire category are based on surveys of representative samples of the population of interest (state residents who have recently given birth for PRAMS, and individuals who obtained abortions for the APS). Each of these surveys have their own set of sampling errors. In addition, while we assume that the pregnancy desires of those having abortions are similar in each state, we also expect there to be some level of variability between states that should be accounted for in our estimates. To account for these multiple sources of error, we used the software package Stan to estimate uncertainty intervals using a simple Bayesian hierarchical model. For births, our general approach was to assume that for each state, the PRAMS estimate of the proportion of respondents in each pregnancy desire response category (denoted
ij, where j is the response category, and i is the state) was the realization of a draw from a truncated normal distribution with true mean μij and standard deviation σij (defined as the standard error of the PRAMS estimate for that response category and state), bounded at 0 and 1. For abortions, we used a similar approach but additionally modeled the (unknown) state-specific proportions of abortions in the wanted-then-or-sooner and wanted-later-or-unwanted categories as being drawn from a truncated normal centered around the true national mean, with the standard deviation set to 0.02 as an informed estimate of how much the proportion of abortions that were from wanted-later-or-unwanted (or wanted-then-or-sooner) pregnancies would be likely to vary between states. The complete Stan code defining this model can be found at https://osf.io/p2eyb/. We do not compute uncertainty intervals around the predicted estimates for states without data, as they would not be directly comparable; the predicted estimates for states without data should be interpreted with caution.
Alternative estimates for California, Idaho and South Dakota
Three states did not participate in PRAMS in 2014 or prior years but have administered survey programs that are based on or are similar to PRAMS and include questions on pregnancy desire. The Pregnancy Risk Assessment Tracking System (PRATS) has been administered annually in Idaho since 2001.35 However, the 2014 PRATS survey in Idaho differed from PRAMS surveys used in other states that year in two significant ways. First, PRATS excluded mothers younger than 18, while PRAMS included all residents giving birth in the state.*** Second, the PRATS survey used the pre-2012 PRAMS question on pregnancy desire and so does not match the format of the question used on the PRAMS surveys in 2014.
California’s Maternal and Infant Health Assessment survey has collected annual data on individuals’ pregnancy desires among all births in the state since 2000. The question on pregnancy desires includes the "I wasn’t sure what I wanted" answer option, but does not include the "I wanted to become pregnant sooner" response option. Because it is not strictly comparable to the PRAMS question, we also considered these data to be unavailable for our set of comparable pregnancy rates.
In South Dakota, a state-wide PRAMS-like survey was conducted in 2014. The survey was modeled on the CDC’s Phase 6 core questionnaire, and does not include the newer version of the pregnancy desire question.36 Thus, we also considered these data to be unavailable for calculating estimates comparable to other states.
For the three states with 2014 survey questions on pregnancy intentions that were not comparable to the 2014 PRAMS survey question, we estimated pregnancy rates by desire category using regression models (Table 2). However, we also estimated pregnancy rates using their data (Appendix Table 1). These rates are comparable to estimates produced in our earlier reports because the measure of pregnancy desire was the same.9
Limitations
•Pregnancy desires among individuals having abortions. The majority of abortions result from pregnancies that were wanted later or unwanted (more than 94%), so we are comfortable using the national distributions of pregnancy desire categories and applying these proportions to all states. However, it is likely that the proportions of pregnancies that originated as wanted later as compared with those not wanted at all vary considerably by state, and so we believe assuming no variation in those proportions—by applying a single, national distribution to all states—would produce inaccurate estimates of the wanted later and unwanted groups if estimated separately. It is for this reason we estimate only the combined wanted-later-or-unwanted pregnancy rate by state.
In contrast, we do estimate a wasn’t-sure pregnancy rate, and that requires that we use the national distribution of that characterization of pregnancy desire from the Guttmacher Institute’s 2014 APS and apply that same distribution to abortions in all states. Unlike the proportion of pregnancies that had been wanted later or not wanted at all, the proportion of abortion patients who reported uncertainty in their pregnancy desire was relatively small. Although there may be variation across states in this proportion, its impact on the estimated pregnancy rate is likely to be small.
It should also be noted that the pregnancy desire question on the 2014 APS is not identical to the question on the 2014 PRAMS survey. The APS uses two questions to categorize the desire status of pregnancies, while PRAMS uses one. In addition, on the abortion survey, there is no response option that specifically states "I wasn’t sure what I wanted." Instead, respondents are offered the option "Not sure." We assumed that these abortions were comparable to the births categorized under "I wasn’t sure what I wanted" and combined the two to estimate the wasn’t-sure pregnancy rates. Some of these respondents to the abortion survey may have been reporting their feelings at the time of the survey, not prior to the pregnancy. However, we reasoned that, for those who would have selected the "I wasn’t sure what I wanted" category (had it been offered), most would have chosen the "Not sure" option on the abortion survey because it would come closest to capturing their prepregnancy attitude toward the pregnancy.
•Potential bias from misreporting of pregnancy desires. If respondents do not accurately report their pregnancy desires in surveys of individuals who gave birth, such as the PRAMS surveys, such misreporting could bias estimates of pregnancies characterized by such desires differentially across states.37 In states with relatively low proportions of pregnancies ending in abortion, the misreporting could have a larger effect on the pregnancy rates than in states with higher proportions ending in abortion, assuming individuals having abortions do not misreport pregnancy desires.
Footnotes
*In addition to the new response option incorporated into the 2012 and subsequent surveys, the question responses were slightly reordered: the "I wanted to be pregnant later" option appeared first in the list. Otherwise, the question wording and all other response categories remained the same.
†Although a small proportion of the pregnancies in this report may have occurred among transgender men or nonbinary people, for the denominators of all rates we are limited to using population counts of women of reproductive age because of Census Bureau data limitations (see Data Sources and Methods Appendix.
‡See Data Sources and Methods Appendix for explanations of the assumptions we made to calculate pregnancy numbers and rates by pregnancy desires.
§New York State (excluding New York City) and New York City carry out independent surveys. We combine data from both surveys to produce estimates for New York State as a whole.
**For these states, we obtained tabulations directly from state health departments or from the states’ online reports.
††One state, Mississippi, conducted a PRAMS survey in 2014, but we were unable to obtain tabulations of data.
‡‡In the APS, respondents are asked to recall pregnancy desires prior to the pregnancy that led to their abortion. They are not offered the "I wasn’t sure what I had wanted" response option, but are offered "not sure."
§§In our analysis, this approximation yields estimates of fetal loss ranging from 15% to 16% of all pregnancies, which is similar to the ranges previously estimated using national data corrected for abortion underreporting.26
***Estimates of the proportion of pregnancies that were wanted later or were unwanted among individuals younger than 20 in Idaho could be too low if teenagers younger than 18—those excluded from the survey—were more likely than 18–19-year-olds to have a birth from a pregnancy that was wanted later or unwanted. However, very few births occur to those aged 17 and younger, especially relative to all other age-groups, so it is unlikely that the overall estimate of pregnancies wanted later or not wanted at all would be affected by an underestimate of the proportion of births that were wanted later or were unwanted among this very young age-group.13
Appendix Table
References
1. U.S. Department of Health and Human Services (DHHS), Healthy People 2020: Topics and Objectives, Washington, DC: DHHS, 2010, http://www.healthypeople.gov/2020/topics-objectives/topic/family-planni….
2. Sonfield A, Hasstedt K and Kavanaugh ML, The Social and Economic Benefits of Women’s Ability to Determine Whether and When to Have Children, New York: Guttmacher Institute, 2013, https://www.guttmacher.org/report/social-and-economic-benefits-womens-ability-determine-whether-and-when-have-children.
3. Kavanaugh ML and Anderson RM, Contraception and Beyond: The Health Benefits of Services Provided at Family Planning Centers, New York: Guttmacher Institute, 2013, https://www.guttmacher.org/report/contraception-and-beyond-health-benefits-services-provided-family-planning-centers.
4. Gipson J, Koenig M and Hindin M, The effects of unintended pregnancy on infant child and parental health: a review of the literature, Studies on Family Planning, 2008, 39(1):18–38.
5. Logan C et al., The Consequences of Unintended Childbearing: A White Paper, Washington: Child Trends and the National Campaign to Prevent Teen and Unplanned Pregnancy, 2007.
6. Kost K and Lindberg L, Pregnancy intentions, maternal behaviors and infant health: investigating relationships with new measures and propensity score analysis, Demography, 2015, 52(1):83–111, doi:10.1007/s13524-014-0359-9.
7. Kavanaugh ML et al., Parents’ experience of unintended childbearing: a qualitative study of factors that mitigate or exacerbate effects, Social Science & Medicine, 2017, 174:133–141, doi:10.1016/j.socscimed.2016.12.024.
8. Jerman J et al., Barriers to abortion care and their consequences for patients traveling for services: qualitative findings from two states, Perspectives on Sexual and Reproductive Health, 2017, 49(2):95–102, doi:10.1363/psrh.12024.
9. Maddow-Zimet I and Kost K, Effect of changes in response options on reported pregnancy intentions: findings from a natural experiment in the United States, paper presented at the Annual Meeting of the Population Association of America, Denver, CO, Apr. 2018.
10. Finer LB and Zolna MR, Declines in unintended pregnancy in the United States, 2008–2011, New England Journal of Medicine, 2016, 374(9):843–852, doi:10.1056/NEJMsa1506575.
11. Johnson-Hanks JA et al., The theory of conjunctural action, in: Understanding Family Change and Variation, Understanding Population Trends and Processes, Springer, Dordrecht, 2011, pp. 1–22, doi:10.1007/978-94-007-1945-3_1.
12. U.S. Census Bureau, Geographical Mobility: 2016 to 2017, 2017, https://www.census.gov/data/tables/2017/demo/geographic-mobility/cps-20….
13. Centers for Disease Control and Prevention (CDC), Vital statistics online data portal: birth data file, 2018, https://www.cdc.gov/nchs/data_access/vitalstatsonline.htm.
14. Shulman HB, PRAMS: The Pregnancy Risk Assessment Monitoring System (PRAMS): overview of design and methodology, American Journal of Public Health, 2018, 108(10):1305–1313, doi:10.2105/AJPH.2018.304563.
15. CDC, PRAMS data: years of data available, 2018.
16. Lindberg L et al., Pregnancy intentions and maternal and child health: an analysis of longitudinal data in Oklahoma, Maternal and Child Health Journal, 2015, 19(5):1087–1096, doi:10.1007/s10995-014-1609-6.
17. D’Angelo DV et al., Differences between mistimed and unwanted pregnancies among women who have live births, Perspectives on Sexual and Reproductive Health, 2004, 36(5):192–197, doi:10.1363/psrh.36.192.04.
18. Hayford SR and Guzzo KB, Age, relationship status, and the planning status of births, Demographic Research, 2010, 23(13):365–398, doi:10.4054/DemRes.2010.23.13.
19. Kost K and Darroch JE, Intention status of U.S. births in 1988: differences by mothers’ socioeconomic and demographic characteristics, Family Planning Perspectives, 27(1):11–17, doi:10.1363/2701195.
20. Pulley L et al., The extent of pregnancy mistiming and its association with maternal characteristics and behaviors and pregnancy outcomes, Perspectives on Sexual and Reproductive Health, 2002, 34(4):206–211, doi:10.1363/3420602.
21. Williams LB, Determinants of unintended childbearing among ever-married women in the United States: 1973–1988, Family Planning Perspectives, 1991, 23(5):212–221, doi:10.2307/2135755.
22. Piironen J and Vehtari A, Sparsity information and regularization in the horseshoe and other shrinkage priors, Electronic Journal of Statistics, 2017, 11(2):5018–5051, doi:10.1214/17-EJS1337SI.
23. Gelman A et al., R-Squared for Bayesian Regression Models, 2017, http://www.stat.columbia.edu/~gelman/research/unpublished/bayes_R2.pdf.
24. Finer LB and Kost K, Unintended pregnancy rates at the state level, Perspectives on Sexual and Reproductive Health, 2011, 43(2):78–87, doi:10.1363/4307811.
25. Kost K, Unintended Pregnancy Rates at the State Level: Estimates for 2010 and Trends Since 2002, New York: Guttmacher Institute, 2015, https://www.guttmacher.org/report/unintended-pregnancy-rates-state-level-estimates-2010-and-trends-2002.
26. Kost K, Unintended Pregnancy Rates at the State Level: Estimates for 2002, 2004, 2006 and 2008, New York: Guttmacher Institute, 2013, https://www.guttmacher.org/report/unintended-pregnancy-rates-state-level-estimates-2002-2004-2006-and-2008.
27. Jatlaoui TC et al., Abortion surveillance — United States, 2014, MMWR Surveillance Summaries, 2017, 66(24):1–48, doi:10.15585/mmwr.ss6624a1.
28. Henshaw S and Kost K, Trends in the Characteristics of Women Obtaining Abortions, 1974 to 2004, New York: Guttmacher Institute, 2008, https://www.guttmacher.org/report/trends-characteristics-women-obtaining-abortions-1974-2004-supplemental-tables.
29. Jones RK and Jerman J, Abortion incidence and service availability in the United States, 2014, Perspectives on Sexual and Reproductive Health, 2017, 49(1):17–27, doi:10.1363/psrh.12015.
30. Special tabulations of data from the Guttmacher Institute’s 2014 Abortion Patient Survey.
31. Jones RK and Kost K, Underreporting of induced and spontaneous abortion in the United States: an analysis of the 2002 National Survey of Family Growth, Studies in Family Planning, 2007, 38(3):187–197.
32. Lindberg L et al., Completeness of abortion reporting in three national surveys in the United States, paper presented at the annual meeting of the Population Association of America, Denver, CO, Apr. 26–28, 2018.
33. Leridon H, Human Fertility: The Basic Components, Chicago: University of Chicago Press, 1977.
34. National Center for Health Statistics (NCHS), Vintage 2016 bridged-race postcensal population estimates for April 1, 2010, July 1, 2010–July 1, 2016, 2017, https://www.cdc.gov/nchs/nvss/bridged_race.htm.
35. Department of Health and Welfare, Division of Public Health, Bureau of Vital Records and Health Statistics, , Results From the 2008 Pregnancy Risk Assessment Tracking System (PRATS) Annual Report, 2012, http://healthandwelfare.idaho.gov/Portals/0/Health/Statistics/Prats/200….
36. Specker B, South Dakota State University, Brookings, SD, personal communication, Nov. 14, 2017.
37. Stevenson AJ and Potter JE, Abortion access and state variation in observed unintended pregnancy, Contraception, 2015, 92(3):227–233, doi:10.1016/j.contraception.2015.04.003.