Using any contraceptive method significantly reduces a woman’s likelihood of becoming pregnant, and the most effective methods virtually eliminate that risk. This common-sense notion is supported by the scientific evidence, as well as by the life experience of tens of millions of American women and couples who have used contraceptives to time and space their childbearing or avoid pregnancy altogether. And yet, a perennial argument put forth by abortion opponents at the federal and state levels holds that contraception does not reduce unintended pregnancy—nor the incidence of abortion—and may actually increase it by leading to more sexual activity and, therefore, more risk.
This argument surfaces regularly in various contexts, including the debate over defunding Planned Parenthood, a leading U.S. provider of contraceptive care and other vital services. During a September 2015 hearing in the U.S. House of Representatives, Rep. James Sensenbrenner (R-WI) said "Well, I don’t think there’s statistics that indicated that that’s the case" in response to a witness who argued that "it makes no sense not to fund [contraceptive] services if you want to reduce the number of abortions."1
Much the same happened in February 2014, when the Guttmacher Institute released a study finding that the U.S. abortion rate had dropped 13% between 2008 and 2011.2 Given that birthrates had also declined substantially during that time, the authors hypothesized that fewer women were experiencing unintended pregnancies. In addition, the evidence suggested that more women were using highly effective contraceptive methods, which further supported the idea that fewer women were having unintended pregnancies thanks to better contraceptive use. At the time, too, abortion-rights opponents disputed that the trend could have been driven by declines in unintended pregnancy generally and by improvements in contraceptive use in particular.
Arguments Debunked
In explaining the 2008–2011 abortion decline, antiabortion activists pointed to the spike in abortion restrictions that started in 2011.3–5 Indeed, between 2011 and 2013, states enacted 205 abortion restrictions; however, this surge in restrictions obviously could not have played a significant role in reducing abortion incidence retroactively. The abortion declines which occurred in 2008–2011 predated the bulk of these new restrictions, with most of them not taking effect until late 2011 or after. Also, abortion rates declined in 44 states and the District of Columbia, including many with few if any restrictions, such as California and New York.
New data further bolster the case that restrictions were not a main factor in the abortion decline. The mechanism by which restrictions would lead to fewer abortions is to force or otherwise compel women to carry an unwanted pregnancy to term. If that were the case, one would expect to see fewer women who experience an unintended pregnancy having abortions. One would also expect an increase in births, and in unplanned births in particular. Neither of these happened during 2008–2011.
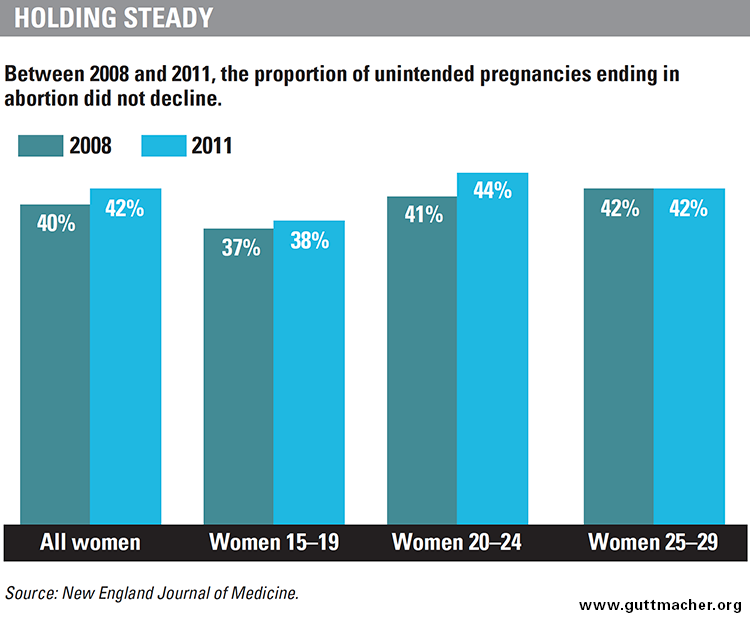
Rather, according to Guttmacher Institute research published in the New England Journal of Medicine (NEJM) in 2016, the proportion of unintended pregnancies ending in abortion did not decline between 2008 and 2011, but stayed relatively stable at 40–42%. Likewise, the rate of unplanned births dropped by almost one-fifth, from 27 to 22 unplanned births per 1,000 women of reproductive age (15–44).6 Unplanned birth rates declined notably among the groups of women who experience the highest rates of abortion: blacks and Hispanics, and those who are low income, cohabiting, have low educational attainment or are in their 20s. With unplanned birth rates down across virtually all demographic groups and the proportion of unintended pregnancies ending in abortion stable across virtually all groups, unplanned births were clearly not replacing abortions to any significant extent during this period. This, in turn, strongly suggests that the 2008–2011 abortion decline was not due to abortion restrictions.
Abortion opponents have also asserted that, beyond restrictions, the 2008–2011 abortion decline was the result of a growing "culture of life," that is, a broad shift in public sentiment against abortion that has prompted more women—in particular, young women of a supposed "prolife generation"—to carry an unintended pregnancy to term.7 The most recent evidence, however, clearly contradicts this claim. Among teenagers aged 15–19, the percentage of unintended pregnancies ending in abortion remained virtually unchanged between 2008 and 2011 (37–38%).6 It also stayed unchanged (at 42%) for those aged 25–29, and even increased slightly (from 41% to 44%) for women aged 20–24 (see chart). In short, among young women as well as women overall, the proportion of unintended pregnancies ending in abortion did not decrease between 2008 and 2011, and the unplanned birth rate fell rather than rose. Taken together, these data provide strong evidence against the claim that the 2008–2011 abortion decline was driven by antiabortion sentiment.
Antiabortion activists did not wait for these data on unintended pregnancy to be available and instead tried to explain the 2008–2011 abortion decline using a different—and insufficient—statistic that was available earlier: the proportion of all pregnancies (rather than unintended pregnancies) ending in abortion. This proportion fell from 23 abortions per 100 pregnancies in 2008 to 21 per 100 in 2011.2 Abortion opponents often erroneously argue that the only possible reason for a decline in this ratio (sometimes called the "abortion ratio") is that more women decide or are made to carry an unintended pregnancy to term, but the new evidence shows that this was not the case.6 Rather, this ratio declined because a smaller proportion of all pregnancies were unintended, which in turn resulted in fewer pregnancies ending in abortion.
Behind the Abortion Decline
Indeed, the NEJM study found that the U.S. unintended pregnancy rate declined 18% between 2008 and 2011—reaching its lowest level in at least three decades. The proportion of U.S. pregnancies that were unintended fell to 45%, down from 51% in 2008. As a result of fewer unintended pregnancies, the rates of both abortion and unplanned birth fell substantially over the period, by 13% and 18%, respectively (see chart). This new evidence goes a long way toward settling the debate over why U.S. abortion incidence declined between 2008 and 2011.
The NEJM study was designed to monitor trends in unintended pregnancy over time, not to pinpoint the reasons behind any changes, but the authors speculate about several factors that might have contributed to the decline they observed.
Changes in sexual behavior? The authors do not consider changes in sexual behavior to have played any significant role, noting that the frequency of sexual activity does not tend to change much among adults. Comprehensive data on adult sexual activity for the 2008–2011 period are not yet available. But among women aged 15–44, various indicators of sexual behavior—such as ever having had sex with a male partner and the number of male sexual partners within the last 12 months—were similar in 2006–2008 compared with 2002.8 Also, levels of teen sexual activity did not change during 2008–2011.9
Demographic shift? Another possible explanation is a shift in the population toward groups that are at lower risk of unintended pregnancy. However, the opposite happened during 2008–2011: The proportion of U.S. women in groups with historically higher rates of unintended pregnancy, such as poor and Hispanic women, increased.10,11 In other words, the overall decline in unintended pregnancy rates happened despite—not because of—these population changes, which makes such significant declines over a short period even more notable.
Greater desire for pregnancy? As a third possible explanation, the authors noted a slightly greater desire for pregnancy, possibly a consequence of the U.S. economy improving after the 2007–2009 recession. However, the authors believe this increase in the intended pregnancy rate only made a small contribution to the unintended pregnancy decline, given that this increase was small compared with the decline in the unintended pregnancy rate.
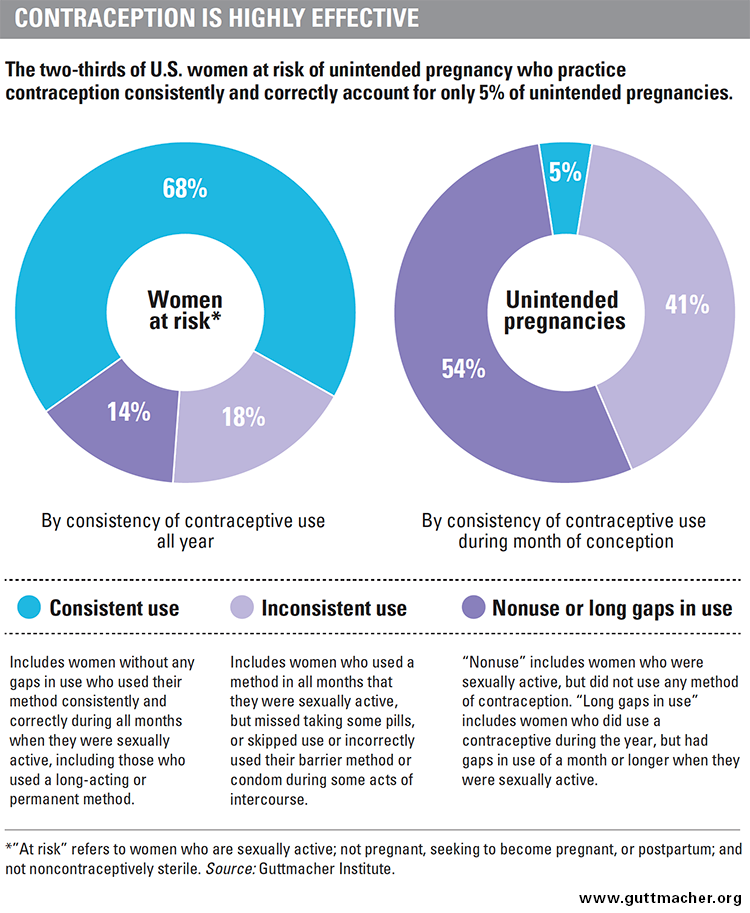
Better contraceptive use. There is considerable evidence, on the other hand, that changes in contraceptive use are a plausible explanation for the decline in unintended pregnancy and subsequent abortion. First, overall use of any contraceptive method increased slightly among women at risk of unintended pregnancy, from 89% in 2008 to 90% in 2012.12,13 Even such a seemingly small increase in contraceptive use can have a measurable impact on unintended pregnancy and abortion rates. Research shows that among all women at risk of unintended pregnancy, the 14% who do not practice contraception over the course of a given year or have long gaps in use account for more than half (54%) of all unintended pregnancies (see chart).14
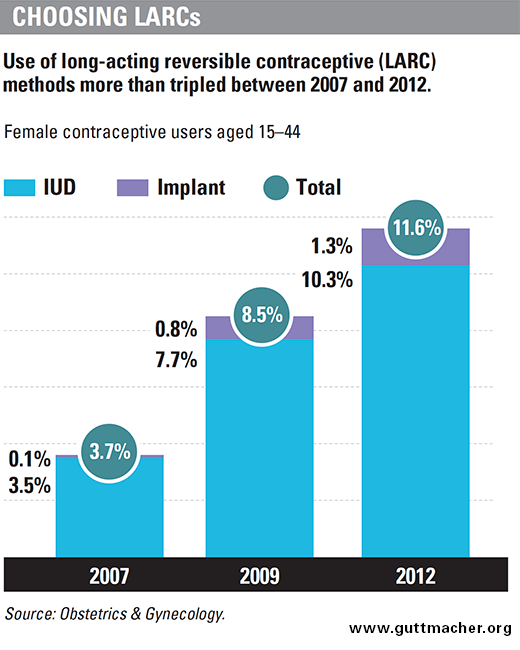
Second, and perhaps more important, women’s use of highly effective contraceptive methods—such as the IUD and implant—has shot up in recent years,15 including during the 2008–2011 period when unintended pregnancy and abortion fell sharply. These highly effective contraceptive methods are often referred to as LARCs, or long-acting reversible contraceptives. Use of these methods, especially the IUD, more than tripled between 2007 and 2012, from 3.7% of all contraceptive users to 11.6% (see chart).
Women weigh many factors when choosing a method, but LARC methods have several important strengths: They are more than 99% effective at preventing pregnancy, may last up to 12 years and do not require women to remember to use their method every day or every time they have sex. Increased use of methods that virtually guarantee consistent and error-free use is a critical development, given that the 18% of women who use contraception inconsistently—for example, by forgetting to take the pill every day or not using a condom every time they have sex—account for 41% of all unintended pregnancies.14 Increases in LARC use likely led to more consistent and effective contraceptive use overall, contributing to the decline in the unintended pregnancy rate.
In short, the evidence is considerable that more and better contraceptive use is the key driver of the 2008–2011 declines in unintended pregnancy and abortion. These trends among all U.S. women appear to echo earlier trends that have helped drive pregnancy, birth and abortion rates among U.S. teens to record lows. Research shows that the teen pregnancy declines between 1995 and 2002 were overwhelmingly the result of improvements in contraceptive use, with contraception accounting for 86% of the decline (and teens delaying sex for the remaining 14%).16 Even more so, the continued teen pregnancy declines between 2003 and 2010—a period with no changes in teen sexual activity—were entirely due to contraceptive use.
Beyond 2011
Without current, comprehensive data on trends in contraceptive use, unintended pregnancy and abortion, it is impossible to know with any certainty what has happened in the period since 2011. Available abortion incidence data are incomplete, but they do suggest that the U.S. abortion rate has continued its long-term decline beyond 2011. A report from the Associated Press, which contacted state health departments to get their latest available abortion data, shows abortion declines across a broad swath of states through at least 2013.17 Similarly, data from the Centers for Disease Control and Prevention show a continued national decline through 2012.18
Several factors are likely contributing to this continued abortion decline. The evidence is strong that state abortion restrictions played no significant role in the 2008–2011 abortion decline, as discussed earlier; however, state restrictions may have had an impact in the post-2011 period. Most restrictions do not keep large numbers of women from obtaining an abortion, but the most burdensome restrictions—such as bans on Medicaid coverage of abortion or requiring women to make two separate trips to an abortion provider—can measurably reduce incidence.19,20 Abortion opponents have embarked on a concerted effort to raise the economic cost of obtaining an abortion, including by layering various types of restrictions on top of each other and through regional clustering of restrictions to make it difficult for women to obtain care in a neighboring state.21,22 This use of coercive laws to make women carry an unwanted pregnancy to term is likely to have had a measurable impact on abortion incidence in some states in the post-2011 period. For instance, one study suggests that a 2013 Texas law that shuttered almost half the state’s facilities that provide abortion care may have contributed to a decline in abortion incidence.23
Still, there is good reason to believe that abortion has continued to decline since 2011, and that continued declines in unintended pregnancy are a factor. For instance, based on the limited available data that the Associated Press gathered, it is notable that abortion appears to have continued to decline even in states that have few or no abortion restrictions, such as New York, Oregon and Washington.17,21 This could be an indication of further, broad-based declines in unintended pregnancy, but it will need to be confirmed using more comprehensive and accurate data.
Another reason to be optimistic about the likelihood of fewer unintended pregnancies since 2011 is the potential for improvements in contraceptive use accompanying the advent of the Affordable Care Act (ACA). Thanks to the ACA, the proportion of U.S. women of reproductive age who are uninsured dropped by more than one-fifth between 2013 and 2014, driven primarily by gains in Medicaid coverage.24 The ACA has also spurred significant improvements in private insurance plans’ contraceptive coverage, leading to a steep decline in out-of-pocket costs for hormonal IUDs,25 the pill and other popular methods,26 and saving U.S. women nearly half a billion dollars in out-of-pocket costs for contraception in 2013 alone.27 Collectively, this evidence illustrates that more women can now choose a birth control method on the basis of which works best for them—as opposed to which they can afford.
It will likely take years until sufficient data are available to know what has happened since 2011 and why. The factors driving changes in abortion incidence will also differ significantly among states. For instance, some states—such as Maine, Ohio, Oklahoma and Texas—have made it more difficult for women to avoid unintended pregnancy in the first place, either by directly cutting funding for family planning services for low-income residents or by making it more difficult for specialized family planning providers to access public funds.28 Attempts to defund Planned Parenthood may be having a serious impact as well. In 2011, Texas banned health centers from participating in its women’s health program if they provide abortion or are associated with a provider that does. As a consequence, the program served far fewer women in 2013 than in 2011.29 Similar attempts to defund Planned Parenthood have flared at both the federal and state levels. Although it is unclear to what extent these attacks can or will succeed, the potential impact on access to contraceptive services could be severe.30
However, even as the post-2011 picture remains murky, evidence from the 2008–2011 period validates the common-sense notion that supporting and expanding women’s access to family planning services not only protects U.S. women’s health and rights, it also reduces abortion rates.