Between 2011 and 2017, the U.S. abortion landscape changed significantly. As documented by the Guttmacher Institute’s periodic abortion provider census, all the main measures of abortion declined, including the number of abortions, the abortion rate and the abortion ratio.1,2 The declines are part of trends that go back decades.
- The number of abortions fell by 196,000—a 19% decline from 1,058,000 abortions in 2011 to 862,000 abortions in 2017.1,2
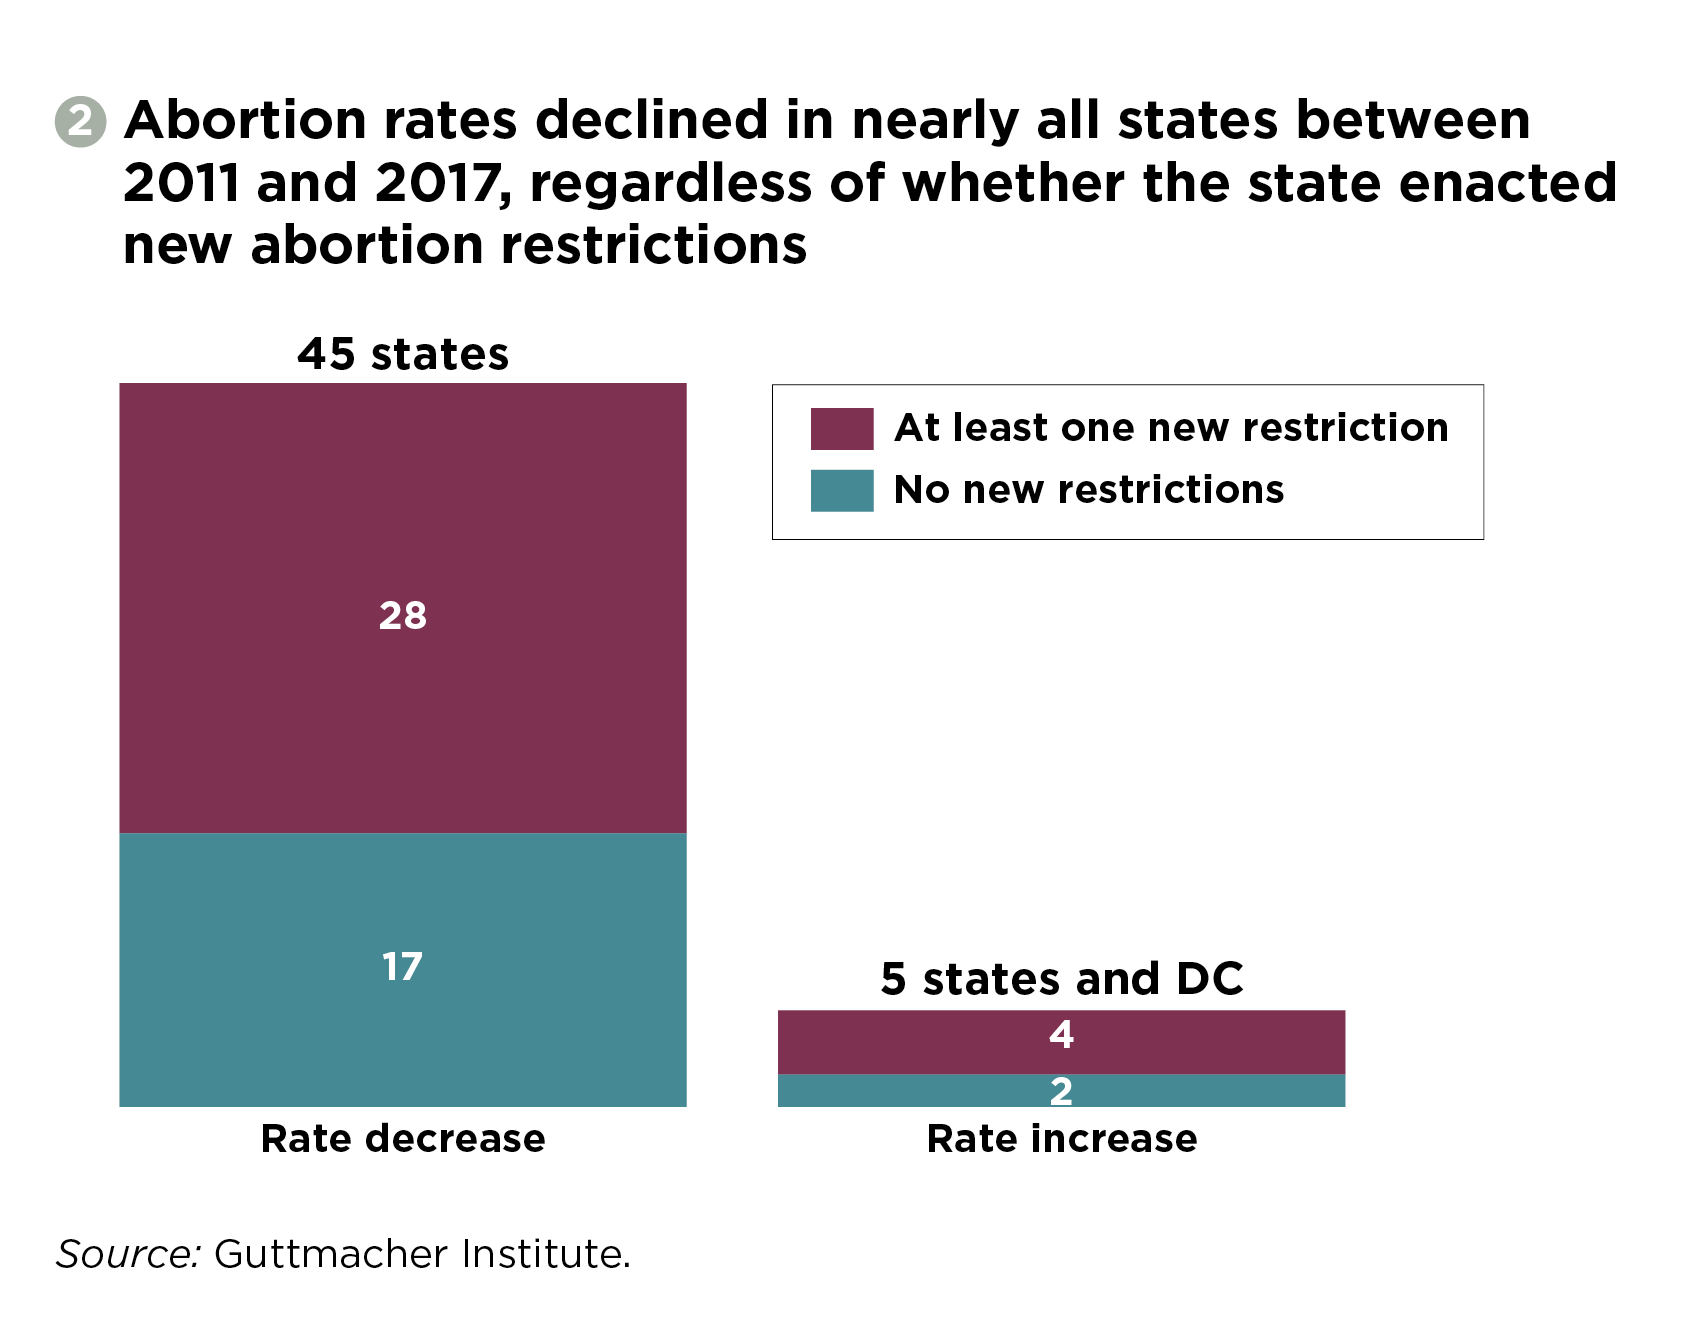
- The abortion rate (the number of abortions per 1,000 women aged 15–44) fell by 20%, from 16.9 in 2011 to 13.5 in 2017.
- The abortion ratio (the number of abortions per 100 pregnancies ending in either abortion or live birth) fell 13%, from 21.2 in 2011 to 18.4 in 2017.
The question of what is behind these trends has important policy implications, and the 2011–2017 period warrants particular attention because it coincided with an unprecedented wave of new abortion restrictions. During that timeframe, 32 states enacted a total of 394 new restrictions,3,4 with the vast majority of these measures having taken effect (that is, they were not struck down by a court).
However, declines in abortion do not serve patients if the reason behind the decline is interference with individuals’ decision making about their reproductive options. Reducing abortion by shuttering clinics and erecting logistical barriers for patients is in direct conflict with sound public health policy, and the debate should not be framed based on the false premise that any reduction in abortion is a good outcome. Rather, it is critical to remember that timely and affordable access to abortion should be available to anyone who wants and needs it. And it is equally important to recognize that obstructing or denying care in the name of reducing abortion is a violation of individuals’ dignity, bodily autonomy and reproductive freedom.
With the available evidence, it is impossible to pinpoint exactly which factors drove recent declines, and to what degree. However, previous Guttmacher analyses have documented that abortion restrictions, while incredibly harmful at an individual level, were not the main driver of national declines in the abortion rate in the 2008–20115 or 2011–20146 time periods. Much the same appears to hold true for the 2011–2017 timeframe, as detailed below. Rather, the decline in abortions appears to be part of a broader decline in pregnancies, as evidenced by fewer births over the same period.
Abortion Restrictions
Abortion restrictions target either individuals’ ability to access the procedure (such as by imposing coercive waiting periods and counseling requirements) or providers’ ability to offer it (such as through unnecessary and intentionally burdensome regulations). Any one of these restrictions could result in some people being forced to continue pregnancies they were seeking to end; this could, in theory, lower the abortion rate.
Restrictions and Clinic Closures
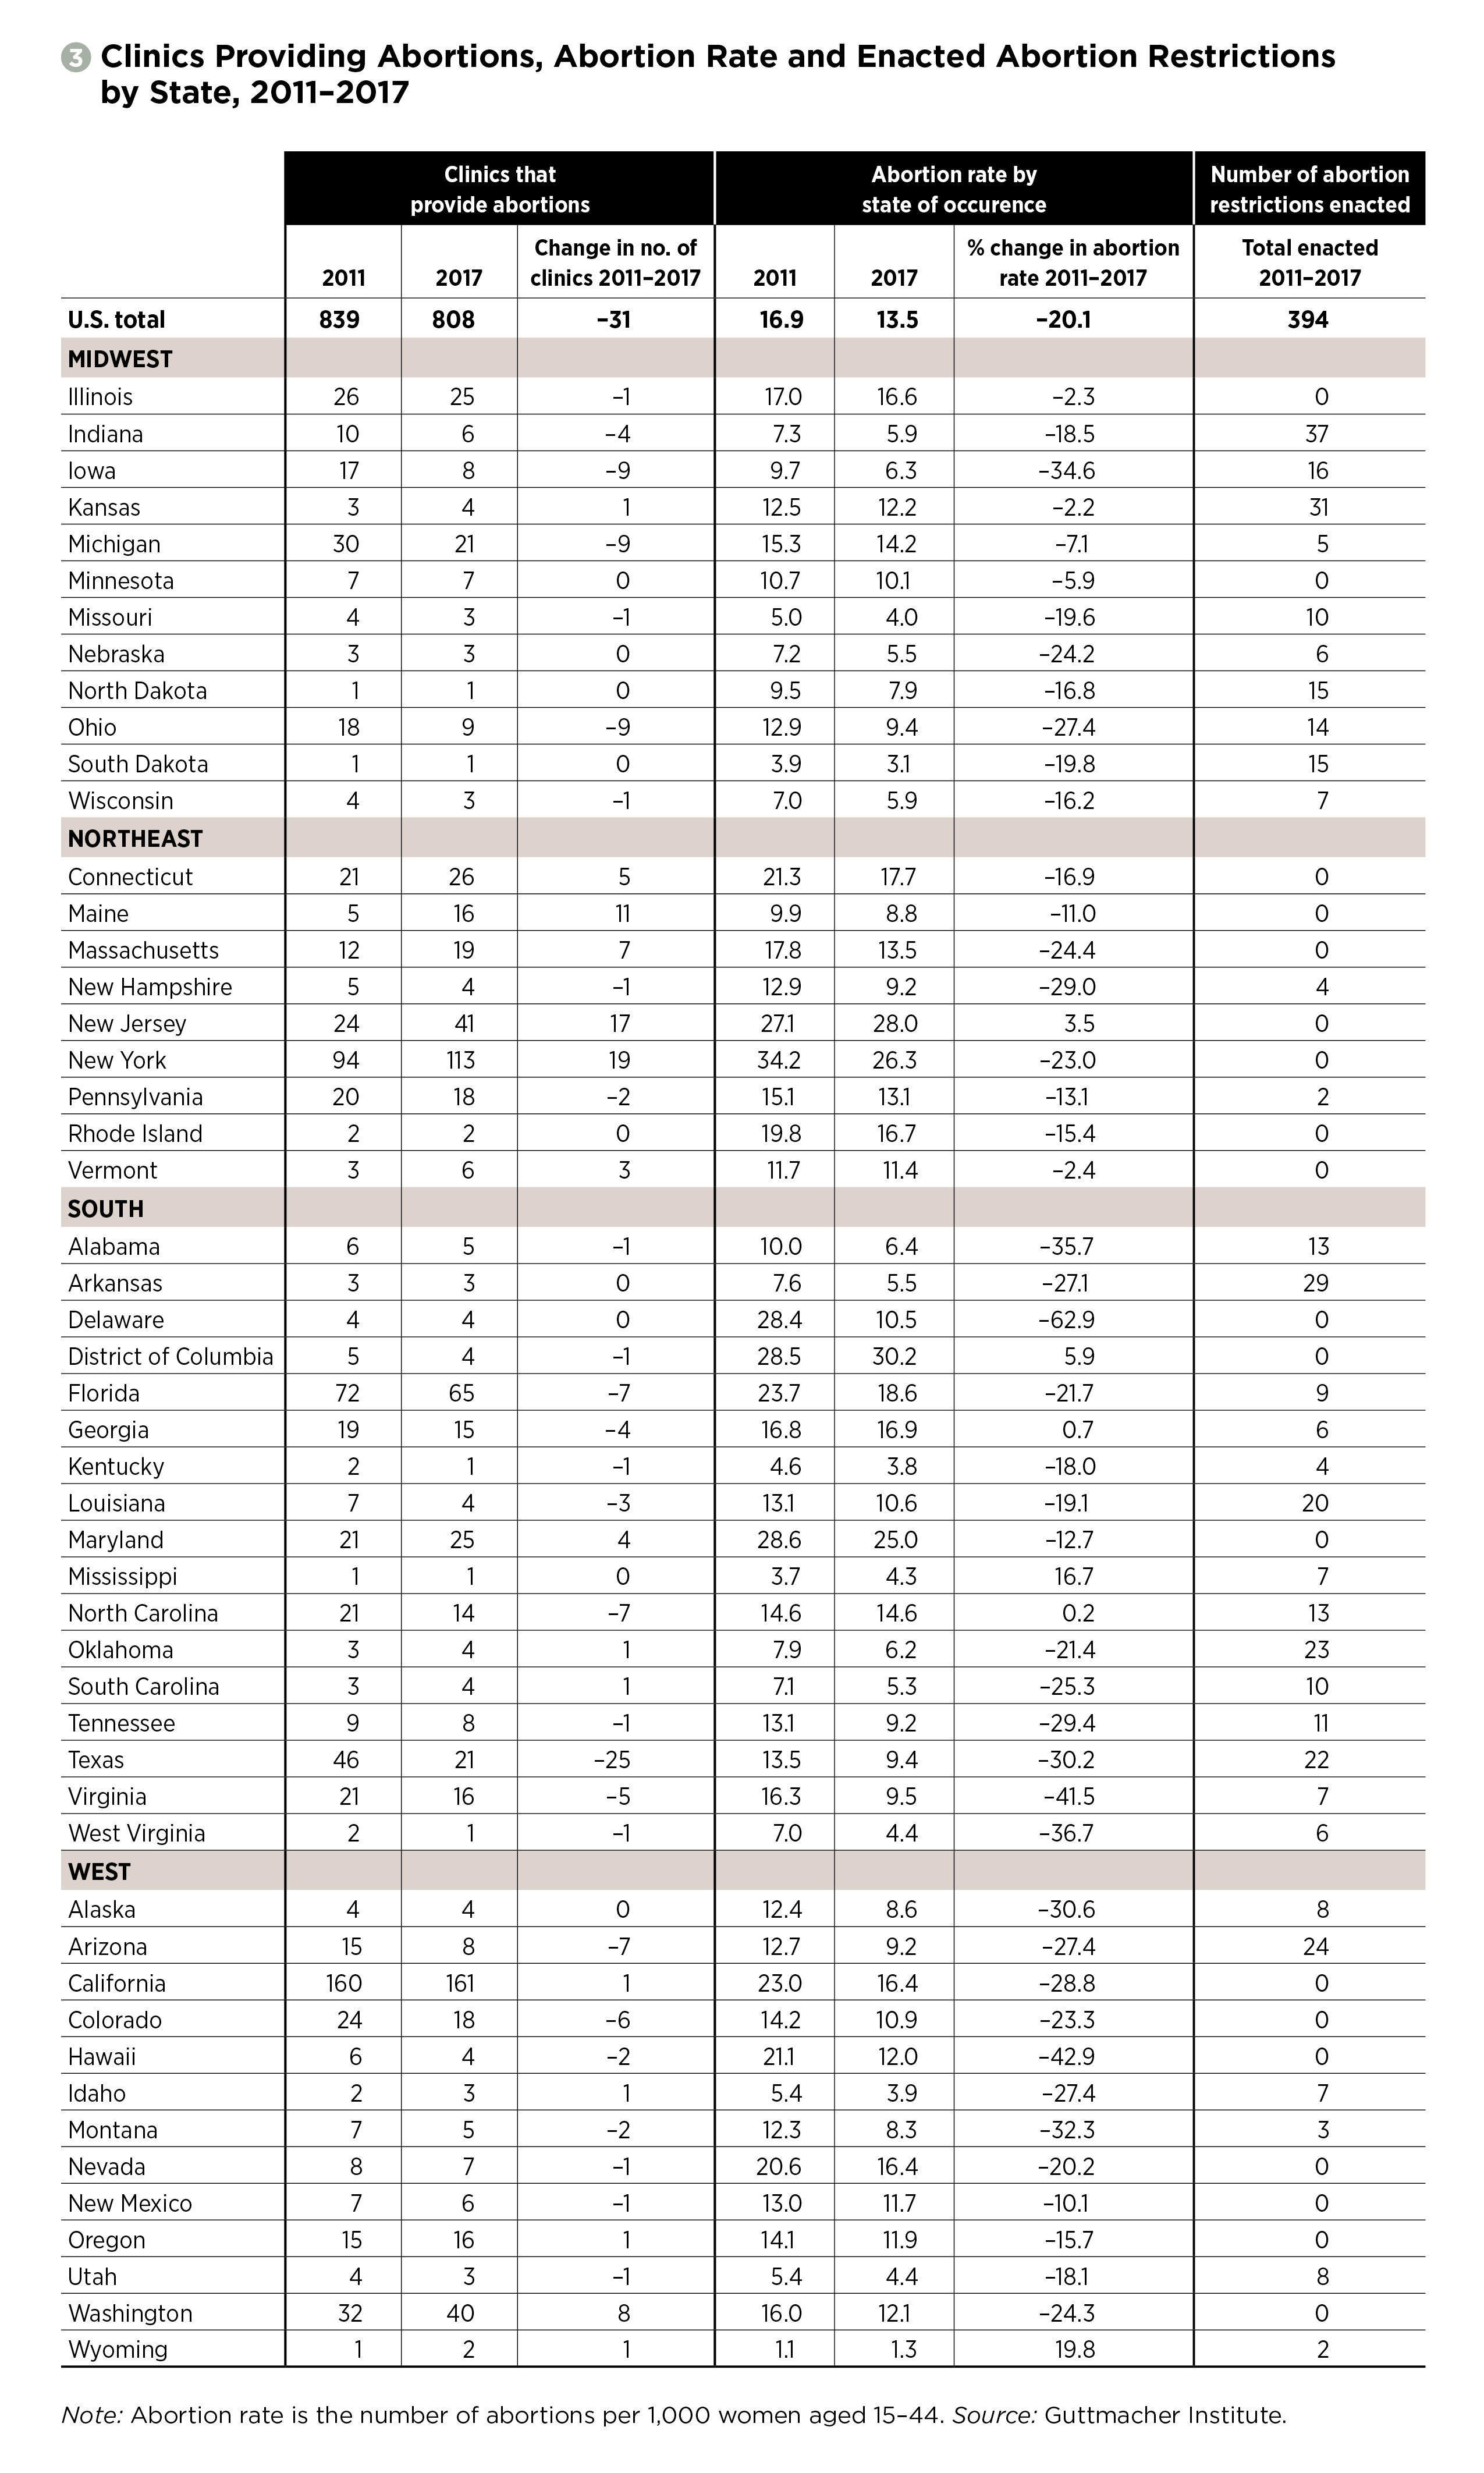
Because 95% of all abortions reported in 2017 were provided at clinics—either those specializing in abortion or those where abortion is part of a broader set of medical services—changes in the number of clinics is a good proxy for changes in abortion access overall.1 Between 2011 and 2017, the number of clinics providing abortion in the United States declined by less than 4%, from 839 to 808.1,2
However, this seemingly modest change masks significant differences by region of the country: Between 2011 and 2017, the South had a net decline of 50 clinics, with 25 in Texas alone, and the Midwest had a net decline of 33 clinics, including nine each in Iowa, Michigan and Ohio.1,2 The West lost a net of seven clinics. By contrast, the Northeast added a net 59 clinics, mostly in New Jersey and New York.
The South and the Midwest also had the largest share of new abortion restrictions during that period, with nearly 86% of total restrictions nationwide enacted in those two regions. It seems clear that these similar geographic patterns are not a coincidence (see figure 1).1,2 In particular, when researchers look at the impact of abortion restrictions on clinic numbers, one type of restriction stands out: TRAP (targeted regulation of abortion providers) laws and administrative regulations did reduce the number of clinics providing abortion between 2011 and 2014.6,7 And although few clinic regulations were enacted between 2014 and 2017, enforcement of existing regulations played a role in the closure of some clinics during that period.8
Between 2011 and 2017, TRAP regulations resulted in the closure of roughly half of all clinics that provided abortion in four states—Arizona, Kentucky, Ohio and Texas—and the closure of five clinics in Virginia, including two of the state’s largest providers.1,2 The clinic regulations in Texas were struck down by the U.S. Supreme Court in 2016 (thereby prohibiting some of the most egregious TRAP laws nationwide) and the Virginia regulations were mostly repealed in 2017.9,10 However, clinic numbers in the affected states did not increase significantly even with these restrictions eliminated, underscoring that once a clinic is forced to close, it can be challenging if not outright impossible for it to reopen.
Smaller changes in clinic numbers are also important, especially in states where access to abortion services is already extremely limited. Missouri, West Virginia and Wisconsin each lost one clinic in the 2011–2017 timeframe out of an already small number in each state.1,2 In cases like this, the remaining clinics typically cannot absorb all the patients seeking abortion care and patients must face greater and sometimes insurmountable obstacles to obtaining an abortion, such as longer travel distances and increased financial costs.11,12
Restrictions and Abortion Rates
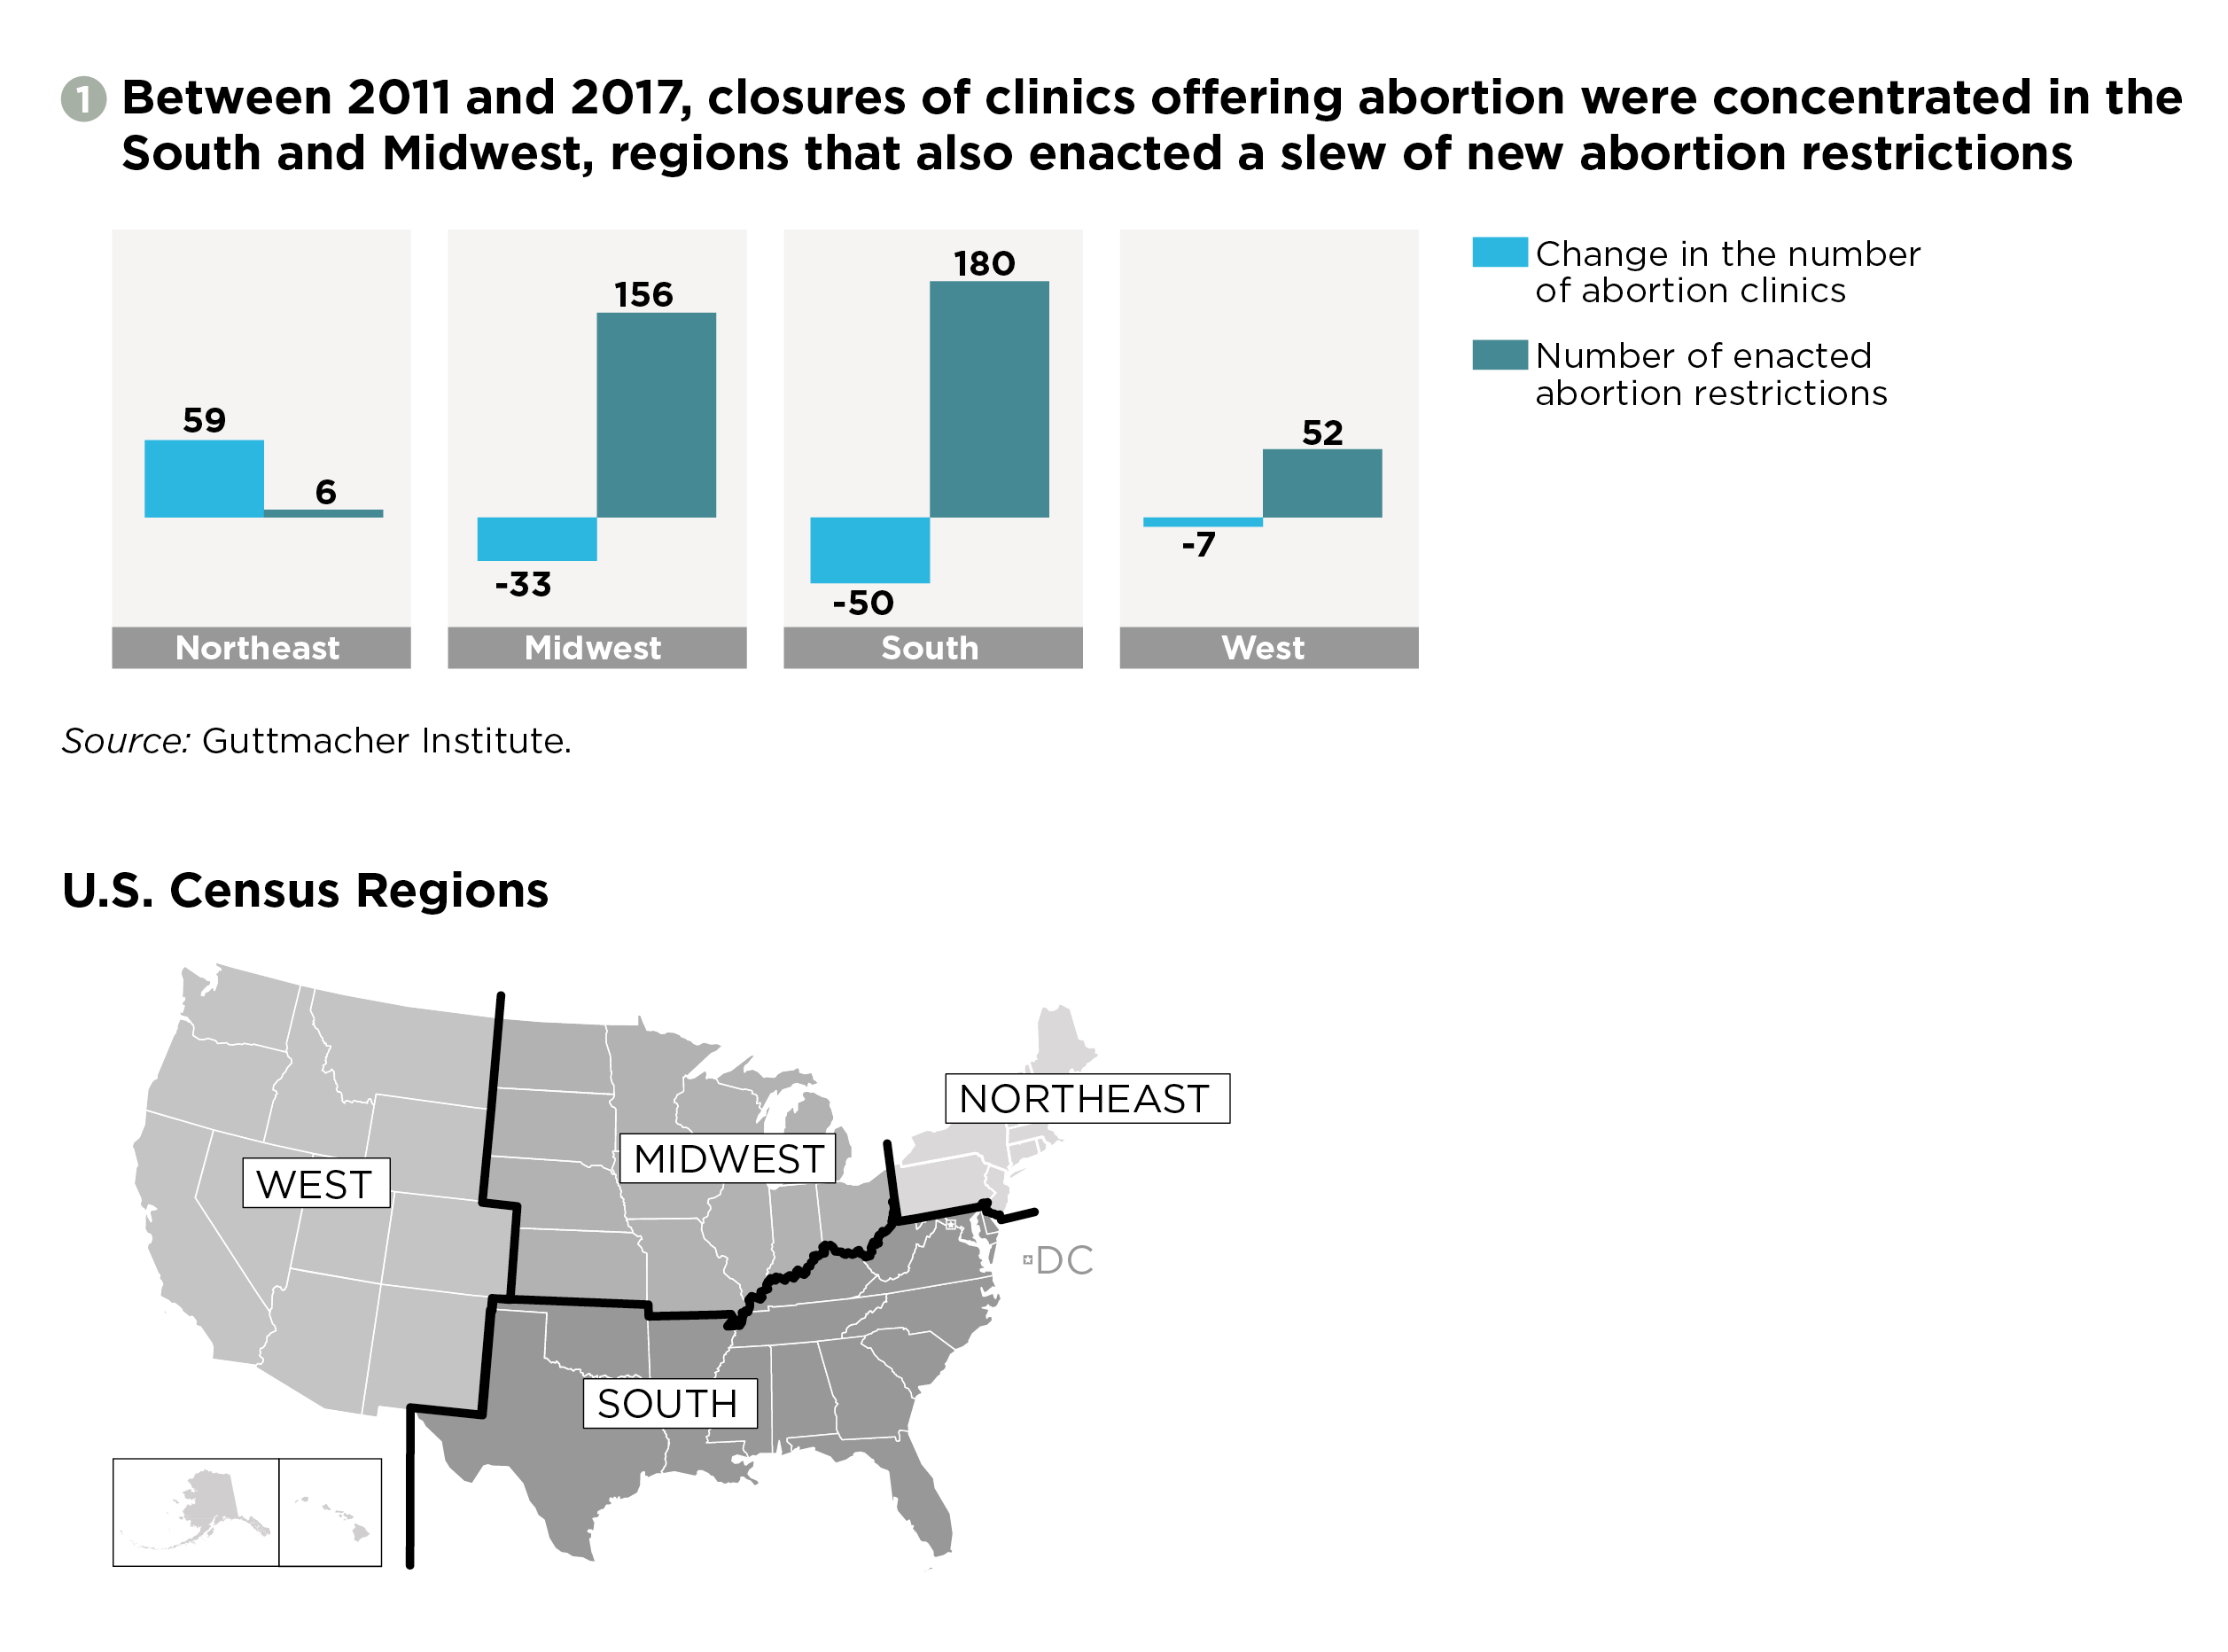
While there appears to be a clear link in many states between abortion restrictions—and TRAP laws in particular—and clinic closures, there is no clear pattern linking abortion restrictions to changes in the abortion rate. While 32 states enacted 394 restrictions between 2011 and 2017,3,4 nearly every state had a lower abortion rate in 2017 than in 2011, regardless of whether it had restricted abortion access (see figure 2).1,4 Several states with new restrictions actually had abortion rate increases.1,4
Notably, 57% of the 2011–2017 decline in the number of abortions nationwide happened in the 18 states and the District Columbia that did not adopt any new abortion restrictions.13 Some of these states, such as California, even took steps to increase access.14 And even in states that enacted new restrictions and saw declines in abortion numbers, it is uncertain what role these restrictions, as opposed to other factors, played in the declines.
Similarly, there is no clear link, even indirectly, from new abortion restrictions to clinic closures to decreases in abortion rates. Among the 26 states and the District of Columbia that had a decline in clinics between 2011 and 2017, 24 states saw declines in their abortion rate (see Figure 3).1,2 However, 13 of the 15 states that added clinics also saw declines in their abortion rates, as did eight of the nine states where the number of clinics stayed the same.
The only exception here may once again be TRAP laws. Four of the states hit hardest by the consequences of TRAP laws over this time period in terms of clinic closures also saw declines in the abortion rate that were larger than the national average of 20%: Arizona (27%), Ohio (27%), Texas (30%) and Virginia (42%).13 Kentucky, which lost one of its two clinics because of the implementation of TRAP regulations, had an abortion rate decline that was slightly lower than the national average (18%).
While there is no clear pattern linking restrictions and abortion declines, restrictions often exact a heavy toll on individuals seeking an abortion. In fact, restrictions are usually enacted with the explicit and cruel intent of creating hardship. Most egregiously, restrictions do keep some people from getting the abortions they want to obtain. And even for those who are able to overcome various barriers, restrictions can cause serious financial and emotional consequences, including by causing delays in obtaining care.15 Yet people have long shown that they will endure these hardships, including by diverting money meant for rent, groceries or utilities to pay for their procedure.
Explaining the Declines
If abortion restrictions are not the main driver of the 2011–2017 abortion decline, what can explain this trend? A number of possible explanations exist, some of them more plausible than others, including changes around abortion attitudes and stigma, contraceptive use, sexual activity, infertility and self-managed abortion.
Attitudes and Choices
Antiabortion activists often argue that more people are turning against abortion rights and that this shift in attitudes can explain broad-based declines in the number of abortions across the country, including in states that did not enact new restrictions. Under this theory, changes in public opinion compel more pregnant individuals to choose to give birth rather than obtain an abortion. This theory is flawed on several levels.
Public opinion on abortion, while fluctuating at times, has remained remarkably stable over the long term. The Pew Research Center found that abortion attitudes in 2018 were essentially the same as in the mid-1990s, with Gallup and an ABC News/Washington Post poll showing very similar trends.16–18 More to the point, these major polls do not show a decline in support for abortion rights between 2011 and 2017. Moreover, if antiabortion activists were truly winning "hearts and minds," they would not need to rely on ever more extreme and coercive abortion restrictions, including an unprecedented wave of abortion bans passed in a number of states in the first six months of 2019.19
A closely related argument focuses on the abortion ratio (the number of abortions per 100 pregnancies ending in either abortion or live birth), which fell 13% between 2011 and 2017.1,2 Abortion opponents often attribute this decline to more pregnant individuals deciding or being forced to carry a pregnancy to term. If this were the case, then there would have been a corresponding increase in births over that time, which did not happen. Rather, both the number of U.S. abortions and the number of U.S. births declined from 2011 to 2017, with births dropping by 98,000 and abortions by 196,000.1,2,20
Fewer Pregnancies
Because both abortions and births declined, it is clear that there were fewer pregnancies overall in the United States in 2017 than in 2011. The big question is why.
One possible contributing factor is contraceptive access and use. Since 2011, contraception has become more accessible, as most private health insurance plans are now required by the Affordable Care Act (ACA) to cover contraceptives without out-of-pocket costs. In addition, thanks to expansions in Medicaid and private insurance coverage under the ACA, the proportion of women aged 15–44 nationwide who were uninsured dropped more than 40% between 2013 and 2017.21 There is evidence that use of long-acting reversible contraceptive methods—specifically IUDs and implants—increased through at least 2014, especially among women in their early 20s, a population that accounts for a significant proportion of all abortions.22 Another study suggests that the use of IUDs might have increased in the wake of the 2016 presidential election, spurred by fears that such methods could become more expensive to access in the future.23 Notably, contraceptive use has driven the long-term decline in adolescent pregnancies and births, which continued through the 2011–2017 period.24,25
Another possible contributing factor might be a decline in sexual activity. Findings from one national survey suggest a long-term increase in the number of people in the United States—mostly younger men—reporting not having sex in the past year.26,27 But in addition to a small sample size, it is unclear how well this survey captures data on sexual behavior. Other data show that the proportion of high school students who have ever had sexual intercourse declined between 2011 and 2017, with most of the decline happening in the 2013–2015 period.28 However, this is unlikely to have had a major impact on the U.S. abortion rate, as minors account for only 4% of abortions overall.29 In sum, the available data do not indicate significant decreases in sexual activity among women in their 20s and 30s, the groups that together account for 85% of all abortions nationally.
Yet another possibility is that infertility is increasing in the United States, thereby reducing the chances of getting pregnant and subsequently seeking to obtain an abortion. However, it is highly unlikely that there would have been a big enough spike in infertility to meaningfully impact pregnancy and abortion rates in the 2011–2017 timeframe.
More generally, there are a host of other potential factors that could be driving declines in pregnancy rates, from individuals’ evolving desires about whether and when to become parents to people’s changing economic and social circumstances.
Self-Managed Abortion
Finally, it is possible that the 2011–2017 decline in abortion was not as large as it appears from the Guttmacher Institute’s abortion provider census: There could have been an increase in self-managed abortions happening outside of medical facilities, which the census would be unable to capture. The Guttmacher abortion census providing data for 2017 found that 18% of nonhospital facilities reported having seen at least one patient who had attempted to end a pregnancy on her own, an increase from 12% in 2014 (the first year that question was included in the survey).1,7 The drugs used in a medication abortion (misoprostol and mifepristone) are becoming increasingly available online, as are resources about how to safely and effectively self-manage an abortion outside of a clinical setting (see "Self-Managed Medication Abortion: Expanding the Available Options for U.S. Abortion Care," 2018). More evidence is necessary to better understand these emerging trends and how to serve the needs of patients as technology and new options for self-managing an abortion are changing access to and availability of abortion.
Centering the Needs of Individuals
We know that abortion restrictions were not the main driver of abortion declines between 2011 and 2017, nor were shifts in public opinion about abortion. Yet, in many ways, that is all beside the point. The reality is that a decline in the abortion rate should not be an end in and of itself.
Rather, declines in abortion rates and the number of clinics are strong reminders that we need to continue to support those seeking abortion, so that they receive timely, accessible, affordable and supportive care. Because despite nearly 40 years of declines in abortion numbers, one in four women of reproductive age nationally will have an abortion in her lifetime.30 Moreover, the legal, logistical and financial barriers to abortion are growing, and these burdens are largely borne by low-income individuals, people of color and young people.
Rather than trying to coerce pregnant individuals into giving birth as their only option, and stigmatizing and targeting abortion patients and providers in the name of reducing abortion, we must center individuals’ needs in their particular circumstances. That means policies must be grounded in medical ethics, including the principles of informed and voluntary consent, which support information on, referral for and access to all pregnancy options. Centering each person’s needs also means providing affordable, high-quality contraceptive and prenatal care, making resources available to raise children with dignity, and improving access to safe, affordable and timely abortion care.