Trends in pregnancy, birth and abortion statistics reflect underlying changes in pregnancy experiences in the US population. Using data that capture all pregnancy outcomes—births, abortions and fetal loss—the Guttmacher Institute calculates pregnancy statistics for a given year.
In addition, Guttmacher conducts research to examine trends in these population-level statistics based on how individuals who experienced a pregnancy recall their prior attitudes toward becoming pregnant or having a baby before the pregnancy occurred. These attitudes are referred to as “pregnancy desires” and are reported in surveys that ask people about their past pregnancy experiences.
US Pregnancy Statistics and Trends
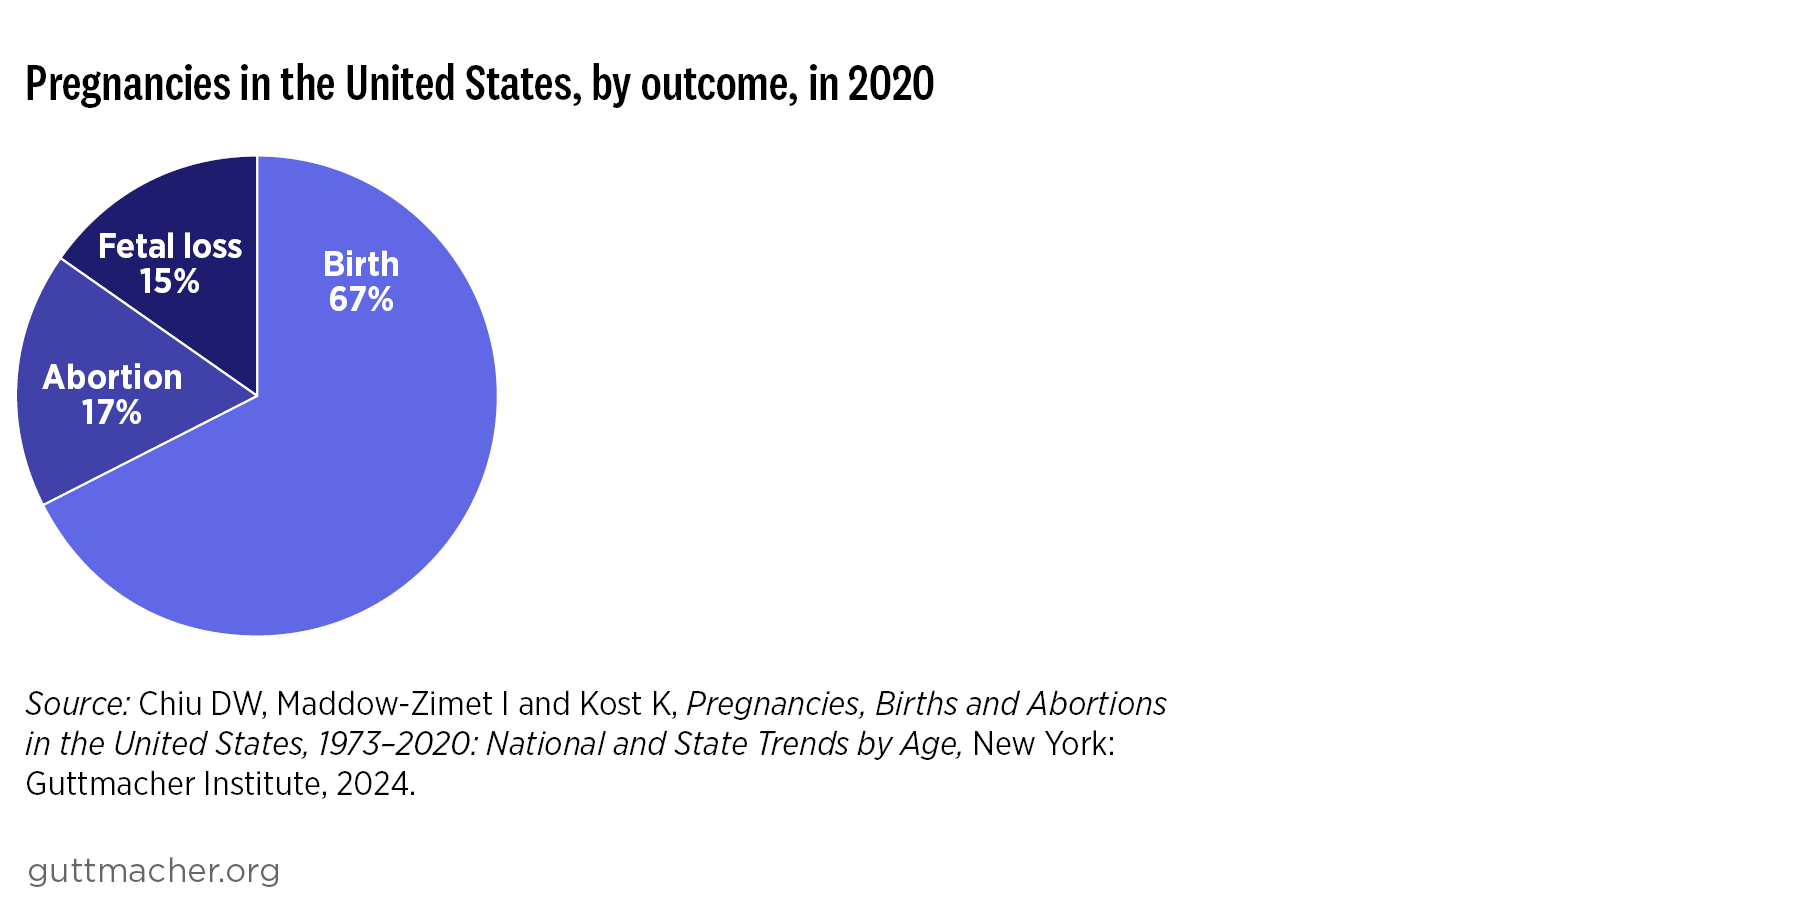
Some 5,359,550 pregnancies occurred in the United States in 2020, the most recent year for which data are available.1
- Of these pregnancies, 67% ended in live birth, 17% in abortion and 15% in fetal loss.
- In 2020, there were 83 pregnancies per every 1,000 women (see box) aged 15–44. This represents the lowest recorded pregnancy rate for the United States.
- The 2020 pregnancy rate reflects declines in rates among the youngest age-groups and increased rates among older women.
- Pregnancy rates have been falling among those aged 24 or younger since the late 1980s. In 2020, there were 11 pregnancies per 1,000 women aged 15–17 (down from a peak of 75 in 1989), 50 pregnancies per 1,000 women aged 18–19 (from a peak of 175 in 1991) and 103 pregnancies per 1,000 women aged 20–24 (from a peak of 202 in 1990).
- In contrast, pregnancy rates among older age-groups have been mostly increasing since 1973. The rate for those aged 35–39 reached a historic high in 2019 (at just over 73 pregnancies per 1,000 women), and the rate for those 40 or older peaked in 2019 (at just over 19 pregnancies per 1,000 women).
- In 2020, pregnancy rates among women aged 15–19 and 20–24 were generally highest in the South and Southwest. Among women aged 30–34, 35–39, and 40 or older, rates were generally highest in the Northwest and Northeast.
US Pregnancy Desires
Research on pregnancy desires focuses on participants’ recalled attitudes toward pregnancy before they became pregnant. Based on these recalled attitudes, participants are asked whether they had wanted to have a baby and if so, whether their pregnancy had occurred at about the right time, later than wanted, or too soon. Data on how women in the United States characterized their pregnancies retrospectively (in 2009, 2011, 2013 and 2015) can help provide critical context for the decline in pregnancy rates over the same time period (2009–2015).2
- During this time period, the rate of pregnancies reported as having occurred too soon decreased by 25%, and the rate of pregnancies reported as not wanted decreased by 14%.
- Across all of these years, pregnancies reported as having occurred at the right time constituted the largest proportion of pregnancies (ranging from 44% to 48% across the four time points).
- As was the case for all pregnancies, the largest proportion of pregnancies resulting in birth were also reported to have occurred at about the right time (54–58%).
- Among pregnancies that ended in abortion, the largest proportions were reported as having occurred too soon (48–49%) or as having been unwanted (42–43%).
- State-specific data on pregnancy and pregnancy desires, including trends from 2012 to 2017, are available in a separate Guttmacher report.
Patterns of Change by Age-Group from 2009 to 2015
Most of the decrease in the overall pregnancy rate between 2009 and 2015 was driven by the decrease in pregnancies among those aged 15–19 and 20–24.2
- In particular, these two age-groups reported significant declines in pregnancies reported to have occurred too soon, with these rates falling by 47% among women aged 15–19 and by 23% among women aged 20–24.
- The rate of unwanted pregnancies also decreased significantly for these two age-groups, falling 46% among 15–19-year-olds and 29% among 20–24-year-olds.
- Women aged 35–44 also experienced a significant decline in the proportion of pregnancies reported to have occurred too soon, falling 39% from 2009 to 2015.
- In contrast to younger women, however, those aged 35–44 also experienced a 26% decline in the proportion of pregnancies reported to have occurred at the right time and an 84% increase in the proportion that occurred later than wanted.
- In addition, the birthrate for pregnancies that occurred later than wanted doubled among women aged 35–44 during this time period.
A demographic rate is the number of events divided by the number of individuals who could experience the event. The accuracy of pregnancy rates depends on having accurate counts of both events (e.g., pregnancies, births or abortions) and the population of people who are able to become pregnant. In reality, that population includes some (though not all) cisgender women, transgender men and people whose gender is nonbinary. To our knowledge, there are no comprehensive estimates of the number or proportion of the US population that is able to become pregnant. As a proxy, the population we use for calculation of rates is the number of women in a given age-group (the denominator), as reported by the US Census Bureau. Consequently, throughout the text, we describe rates as being among women, although counts of events (the numerator: births, abortions, fetal losses or all pregnancies) include outcomes among all people able to become pregnant, regardless of their gender.
Additional Resources and Critiques
The findings in this fact sheet are based on “retrospective” data: how individuals recall their desires for pregnancy in relation to a pregnancy in their past. Another body of research addresses individuals’ “prospective” pregnancy desires, related to current and future thoughts and feelings about pregnancy. Past efforts to study retrospectively measured pregnancy desires in the United States focused primarily on “unintended” pregnancy and have been widely critiqued by multiple scholars who offer alternative perspectives on both the value of this measurement and appropriate ways to capture more nuanced—and potentially more accurate—scientific representations of individuals’ attitudes toward a pregnancy experience. For example, see:
- Potter JE et al., Challenging unintended pregnancy as an indicator of reproductive autonomy. Contraception, 2019, 100(1):1–4, https://doi.org/10.1016/j.contraception.2019.02.005.
- Kost K and Zolna M, Challenging unintended pregnancy as an indicator of reproductive autonomy: a response, Contraception, 2019, 100(1):5–9, https://doi.org/10.1016/j.contraception.2019.04.010.
- Gómez AM et al., It’s not planned, but is it okay? The acceptability of unplanned pregnancy among young people, Women's Health Issues, 2018, 28(5):408–414, https://doi.org/10.1016/j.whi.2018.07.001.
- Aiken ARA et al., Rethinking the pregnancy planning paradigm: unintended conceptions or unrepresentative concepts? Perspectives on Sexual and Reproductive Health, 2016, 48(3):147–151, https://doi.org/10.1363/48e10316.
- Gómez AM et al, The misclassification of ambivalence in pregnancy intentions: a mixed-methods analysis, Perspectives on Sexual and Reproductive Health, 2019, 51(1):7–15, https://doi.org/10.1363/psrh.12088.
- Maddow-Zimet I and Kost K, Effect of changes in response options on reported pregnancy intentions: A natural experiment in the United States. Public Health Reports, 2020, 135(3):354–363, https://doi.org/10.1177/0033354920914344.