Guttmacher Institute

Search

  • X
  • Facebook
  • Instagram
  • Youtube
  • LinkedIn
  • Contact

Highlights

  • Reproductive Health Impact Study
  • Adding It Up
  • Abortion Worldwide
  • Guttmacher-Lancet Commission
  • US policy resources
  • State policy resources
  • International Perspectives on Sexual and Reproductive Health (1975–2020)
  • Perspectives on Sexual and Reproductive Health (1969–2020)

Reports

  • Global
  • United States

Articles

  • Global research
  • US research
  • Policy analysis
  • Guttmacher Policy Review
  • Opinion

Fact Sheets

  • Global
  • United States
  • US State Laws and Policies

Tools

  • Interactive Map: US Abortion Policies and Access After Roe
  • Family Planning Investment Impact Calculator
  • Monthly Abortion Provision Study Dashboard
  • State legislation tracker
  • Public-use data sets

Global

  • Abortion
  • Contraception
  • Pregnancy
  • Teens

US

  • Abortion
  • Contraception
  • Pregnancy
  • Teens

Our Work by Geography

  • Global
  • Africa
  • Asia
  • Europe
  • Latin America & the Caribbean
  • Northern America
  • Oceania

Who We Are

  • About
  • Staff
  • Board
  • Job opportunities
  • Newsletter
  • History
  • Contact
  • Conflict of Interest Policy

Media

  • Media office
  • News releases

Support Our Work

  • Make a gift today
  • Monthly Giving Circle
  • Ways to Give
  • Guttmacher Guardians
  • Guttmacher Legacy Circle
  • Financials
  • Impact Report 2025

Awards & Scholarships

  • Darroch Award
  • Richards Scholarship
  • Bixby Fellowship
Donate
Guttmacher Institute
Donate

Highlights

  • Reproductive Health Impact Study
  • Adding It Up
  • Abortion Worldwide
  • Guttmacher-Lancet Commission
  • US policy resources
  • State policy resources
  • International Perspectives on Sexual and Reproductive Health (1975–2020)
  • Perspectives on Sexual and Reproductive Health (1969–2020)

Reports

  • Global
  • United States

Articles

  • Global research
  • US research
  • Policy analysis
  • Guttmacher Policy Review
  • Opinion

Fact Sheets

  • Global
  • United States
  • US State Laws and Policies

Tools

  • Interactive Map: US Abortion Policies and Access After Roe
  • Family Planning Investment Impact Calculator
  • Monthly Abortion Provision Study Dashboard
  • State legislation tracker
  • Public-use data sets

Global

  • Abortion
  • Contraception
  • Pregnancy
  • Teens

US

  • Abortion
  • Contraception
  • Pregnancy
  • Teens

Our Work by Geography

  • Global
  • Africa
  • Asia
  • Europe
  • Latin America & the Caribbean
  • Northern America
  • Oceania

Who We Are

  • About
  • Staff
  • Board
  • Job opportunities
  • Newsletter
  • History
  • Contact
  • Conflict of Interest Policy

Media

  • Media office
  • News releases

Support Our Work

  • Make a gift today
  • Monthly Giving Circle
  • Ways to Give
  • Guttmacher Guardians
  • Guttmacher Legacy Circle
  • Financials
  • Impact Report 2025

Awards & Scholarships

  • Darroch Award
  • Richards Scholarship
  • Bixby Fellowship
Donate
  • X
  • Facebook
  • Instagram
  • Youtube
  • LinkedIn
  • Contact

Infographics

Skip to filters
  1. Illustration de la citation d’Ann M. Starrs sur la Commission Guttmacher-Lancet.
    May 2018 Infographic

    Citation d’Ann M. Starrs sur la Commission Guttmacher-Lancet

  2. Graphic showing that more than 350 million people need treatment for one of the four curable STIs worldwide each year
    May 2018 Infographic

    Annual need for STI treatment worldwide

  3. May 2018 Infographic

    Para impulsar la salud, necesitamos impulsar los derechos

  4. Graphic: U.S. Foreign aid helps women and families, and saves lives
    April 2018 Infographic

    U.S. foreign aid helps women and families and saves lives, 2018

  5. Graph: Unintended pregnancy has declined as the use of modern contraceptives has increased
    March 2018 Infographic

    Declines in unintended pregnancy rates worldwide from 1990 to 2014

  6. Graph: The proportion of abortions that are unsafe is much higher in countries where laws are more restrictive
    March 2018 Infographic

    Disparities in safety of abortions across countries with varying legal restrictions

  7. Infografía: Las mujeres en países de bajos ingresos tienen mayor probabilidad de tener un aborto inseguro
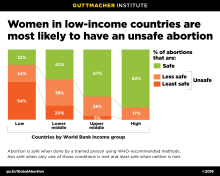
    March 2018 Infographic

    Variaciones en la seguridad de los abortos entre países según nivel de ingresos

  8. Élargir les critères légaux d’accès à l’avortement et promouvoir les lignes directrices cliniques mises à jour
    March 2018 Infographic

    Recommandations pour la réduction de l’impact de l’avortement non médicalisé

  9. Les taux d’avortement sont stables dans les régions en développement alors qu’ils ont baissé dans les régions développées
    March 2018 Infographic

    Évolution des taux d’avortement dans le monde entre 1990 et 2014

  10. Decision makers should liberalize abortion laws & promote updated clinical guidelines for safe abortion and postabortion care
    March 2018 Infographic

    Recommendations to reduce the impact of unsafe abortion

  11. Graph: Abortion rates remained steady in developing regions from 1990 to 2014, while declining in developed regions
    March 2018 Infographic

    Changes in worldwide abortion rates from 1990 to 2014

  12. Infografía: El embarazo no planeado ha disminuido conforme el uso de anticonceptivos modernos ha aumentado
    March 2018 Infographic

    Disminuciones en las tasas de embarazo no planeado a nivel mundial desde 1990 hasta 2014

  13. Infografía: La proporción de abortos inseguros es mucho más alta en países donde las leyes son más restrictivas
    March 2018 Infographic

    Disparidades en la seguridad de los abortos entre países con diferentes restricciones legales

  14. Infographie: Les femmes dans les pays à revenu faible sont les plus susceptibles de subir un avortement non médicalisé
    March 2018 Infographic

    Variations de la sécurité des avortements entre pays, selon le niveau de revenu

  15. Graph: Women in low-income countries are most likely to have an unsafe abortion
    March 2018 Infographic

    Variations in safety of abortions across countries by income level

Pagination

  • First page First
  • Previous page Prev.
  • …
  • Page 7
  • Page 8
  • Page 9
  • Page 10
  • Current page 11
  • Page 12
  • Page 13
  • Page 14
  • Page 15
  • …
  • Next page Next
  • Last page Last

Refine resources

Topic
Year range
Language
Skip to results
Guttmacher Institute

Center facts. Shape policy.
Advance sexual and reproductive rights.®

Donate Now
Newsletter Signup  Contact Us 
  • X
  • Facebook
  • Instagram
  • Youtube
  • LinkedIn
  • Contact

Footer

  • Privacy Policy
  • Accessibility Statement
© 2025 Guttmacher Institute. The Guttmacher Institute is registered as a 501(c)(3) nonprofit organization under the tax identification number 13-2890727. Contributions are tax deductible to the fullest extent allowable.