In the developing world, 74 million unintended pregnancies occur annually, of which 30% are due to contraceptive failure among women using traditional or modern contraceptive methods, a significant proportion of all unintended pregnancies. Detailed information on contraceptive failure rates is critical to inform improvements in provision of contraceptive information, supplies, and services, which can assist women and couples to use contraception correctly and consistently.
Contraceptive Failure Rates in the Developing World: An Analysis of Demographic and Health Survey Data in 43 Countries
Reproductive rights are under attack. Will you help us fight back with facts?
Key Points
Key Points
- Using self-reported data from national surveys of women aged 15–49, we estimated typical-use contraceptive failure rates for seven methods at 12, 24 and 36 months of use. We provide a median estimate for each method across 43 countries overall, in seven subregions and in individual countries. We also give estimates for various demographic and socioeconomic populations. Estimates are not corrected for potential errors in reporting contraceptive use or potential underreporting of abortion, which may vary by country.
- Across all countries analyzed, reported 12-month failure rates were lowest for users of longer-acting methods such as implants (0.6 failures per 100 episodes of use), IUDs (1.4) and injectables (1.7); intermediate for short-term resupply methods such as oral contraceptive pills (5.5) and male condoms (5.4); and highest for users of traditional methods such as withdrawal (13.4) or periodic abstinence (13.9), a group largely using calendar rhythm.
- The 12-month failure rate varied across subregions: The range was 0.2–1.3 per 100 episodes of use for implants, 0.9–2.2 for IUDs, 0.9–4.2 for injectables, 3.6–8.5 for oral contraceptive pills, 2.2–8.7 for male condoms, 7.8–17.1 for withdrawal and 6.1–20.9 for periodic abstinence.
- We assessed differences in contraceptive failure rates by age, marital status, parity, contraceptive intention, wealth, residence and education. Of these, age was associated with the largest differences in rates. For all methods except implants (for which the failure rate did not vary by age), 12-month contraceptive failure rates were higher among women younger than 25 years as compared with their older counterparts.
- Although comparing our estimates for contraceptive failure rates with those for the United States is complex, ours were somewhat higher than U.S. estimates derived from clinical data for implants (0.6 vs. 0.05 per 100 episodes of use) and IUDs (1.4 vs. 0.8). On the other hand, ours were markedly lower than U.S. estimates for injectables (1.7 vs. 6), oral contraceptive pills (5.5 vs. 9), male condoms (5.4 vs. 18), withdrawal (13.4 vs. 22) and periodic abstinence (13.9 vs. 24).
- Our findings help to highlight those methods, subregions and population groups that may be in need of particular attention for improvements in policies and programs to address high levels of contraceptive failure.
Introduction
Many women and couples around the world desire fewer children than they already have; others want to prevent or control the timing of future births but don’t always succeed. Unintended pregnancy is common: Worldwide, approximately 85 million pregnancies (40% of all pregnancies) were unintended in 2012.1 In the developing world, 74 million unintended pregnancies occur annually, of which a sizable share, 30%, are due to contraceptive failure among women using some type of contraceptive method (whether traditional or modern).2 This includes both method-related failures (i.e., failure of a method to work as expected) and user-related failures (i.e., failure stemming from incorrect or inconsistent use of a method). Detailed information on contraceptive failure rates is critical to inform improvements in provision of contraceptive information, supplies and services, which can help women and couples to use methods correctly and consistently.
Unintended pregnancies can have many undesirable consequences, including unwanted childbearing, recourse to (potentially unsafe) abortion, and morbidity and mortality among mothers, newborns or both.3–5 In 2012, 38% of all unintended pregnancies worldwide ended in an unplanned birth, 13% in miscarriage, and 50% in abortion.1 Unintended pregnancy, as well as its two main outcomes (unplanned birth and abortion), can have negative consequences for women, and in the case of unplanned birth, also for newborns. For example, although elective abortion may resolve unwanted pregnancy, access to safe procedures is not always available, especially in developing countries. In 2008, about 40 million abortions occurred worldwide, approximately 22 million of which were unsafe.6 Furthermore, a review published the same year suggested an association between unintended pregnancy and delayed initiation of antenatal care, a decreased number of antenatal care visits, or both in developed and some developing countries.
A small number of studies have focused on estimating contraceptive failure rates in developed or developing countries.7–13 Much of what is known about these rates in developing countries comes from Demographic and Health Survey (DHS) data. For example, Ali et al.14 assessed causes and consequences of contraceptive discontinuation using DHS data from married women in 19 countries. Using single-decrement life tables, they found that median values for contraceptive failures by 12 months were 1.1% for the IUD, 1.5% for injectables, 5.6% for the pill, 7.6% for the male condom, 15.3% for withdrawal and 17.4% for periodic abstinence (the rate for sterilization was not assessed). Reported failure rates were lowest for IUD and injectable users, intermediate for pill and condom users, and highest for users of withdrawal or periodic abstinence.
Other studies have estimated contraceptive failure rates using DHS data, although many have restricted analysis to particular subgroups or a limited number of countries. For example, some studies11,14,15 assessed rates only among women who were married at the time of interview, and others analyzed data from 25 or fewer countries.7,16 Moreover, studies using DHS data often estimate 12-month failure rates; less is known about rates beyond 12 months.
We undertook a study to update contraceptive failure rates and provide a more comprehensive global picture. Our study takes advantage of the increasing number of DHS countries with reproductive calendar data - questions asked about contraceptive use for each month of the last five years before the interview - to increase knowledge of contraceptive failure rates. We provide new estimates of contraceptive failure in 43 countries across seven subregions using recent data; more than half of the included surveys were conducted in 2010 or more recently. Specifically, we report data for 10 countries in Eastern Africa, five in Western Africa, six in Northern Africa and Western Asia, five in Eastern Europe and Central Asia, five in Southern Asia, four in Southeastern Asia, and eight in Latin America and the Caribbean.
Because our primary interest is comparing contraceptive failure rates for each method across countries and demographic and socioeconomic groups, we calculated rates using a single-decrement approach. Other studies using DHS data have used a multiple-decrement approach to calculate failure rates for different purposes.15,16
We calculated failure rates for all sexually active women rather than only married women (with the exception of seven included DHS surveys* that included only ever-married women). We also calculated estimates for durations of contraceptive use longer than 12 months (specifically, for 24 and 36 months) and for subgroups stratified by demographic and socioeconomic characteristics (such as age, education, marital status and wealth). We pooled data for countries within the same geographic subregion to estimate failure rates at the subregional level, permitting more stable estimates. Potential limitations of our data and methods are described to properly contextualize our results.
By using data from 43 countries to present the most comprehensive and detailed estimates of contraceptive failure rates to date, we hope this report can provide policymakers and program planners with useful information to help mitigate the challenges that women and couples face in using contraceptives effectively.
Data Sources and Methods
We used data from 43 Demographic and Health Surveys (DHS), which are large-scale, nationally representative household surveys that include interviews with women of reproductive age (15–49). Participants are asked about pregnancies, births, terminations and episodes of contraceptive use that occurred over the past five or more years, producing a retrospective month-by-month reproductive calendar history for each woman. For each episode of contraceptive use that was discontinued, women are asked, "Why did you stop using the (method)?" Responses are categorized into one of 14 precoded responses, including "became pregnant while using" (i.e., reported contraceptive failure). These histories allow use of life table methods to calculate failure rates by contraceptive method.17
Failure rates in this report are calculated based on women’s self-reports (which are subject to recall and other biases, as described in detail below) and should be interpreted as typical use failure rates for women using a specific contraceptive method in a specific setting, rather than as clinical or perfect use failure rates. Typical-use contraceptive failure rates reflect actual use of the method (including inconsistent and incorrect use), whereas perfect-use failure rates reflect the effectiveness of a method if instructions for use are perfectly followed at all times.
Data Sources
Countries and Surveys Included in Analysis
We used the most recent (as of June 2014) DHS survey available in each country that included a reproductive calendar containing information on reasons for contraceptive discontinuation. More than half of the surveys analyzed were conducted in 2010 or later. For nearly all countries, we used the most recent survey, but for a small number,† that survey either did not collect the reproductive calendar or did not include the information on the reasons for discontinuation in the calendar that is necessary for calculating the contraceptive failure rate.‡ For example, in Kenya, Ethiopia and Malawi, calendar data including reasons for contraceptive discontinuation were collected in 2003, 2005 and 2004 respectively, but not in the more recent surveys conducted in 2008–2009, 2010 and 2011. For these countries, we used the latest survey that collected the necessary information, excluding from analysis the more recent ones that did not. Additionally, some countries (notably Bolivia, Brazil, Guatemala and Paraguay) no longer collect data through DHS surveys. Rather than exclude them, we used data from older surveys to ensure more comprehensive representation, especially for the Latin America and Caribbean (LAC) region. Some studies indicate that differences in contraceptive failure rates over time may be small (which supports our decision to include older surveys), although they may be larger for certain user-dependent methods.13,14 Thus, although we included older surveys for comprehensiveness, we acknowledge the limitations of doing so and note that estimates may not always reflect the most current situation.
The 43 included countries are shown in Table 1. They cover a wide range of socioeconomic contexts and patterns of contraceptive use. One-third of the countries come from Sub-Saharan Africa; one-quarter from North African, West Asian, Eastern European and Central Asian countries combined; and the rest are relatively evenly split between Southern and Southeastern Asia and LAC. The countries cover a substantial proportion of the population in Eastern Africa (81% based on UN population estimates18), Western Africa (69%), Southern Asia (92%) and Southeastern Asia (73%), but the data are less representative in other subregions (Appendix Table 1). For LAC, the countries included cover only 54% of the population, largely because data were not available from Mexico, the second most populous country in that subregion. Countries from Northern Africa and Western Asia cover 47% of the population for that subregion, and those included for Eastern Europe and Central Asia cover just 22%.
Calculation of Failure Rates
We assessed contraceptive failure rates across the 43 included countries in two ways: by ascertaining the median failure rate by method across all countries and by calculating a pooled failure rate across all countries. Further detail regarding the two approaches is available in Appendix B.
We also pooled data from multiple countries within the same subregion. As countries included in our study are not necessarily representative of their respective subregions, we created these pooled subregional estimates by giving equal weight to each country, regardless of population size. For example, although India’s population is about 45 times larger than Nepal’s, data from the two countries contribute equally to the Southern Asia pooled estimates. These pooled estimates should therefore be interpreted as average method-specific rates across the countries (with data) in each subregion. Weighting by population size would be a reasonable approach if data were available for all or almost all countries, or for countries that constitute the large majority of the population of all subregions. However, this was not the case for the data available to estimate contraceptive failure rates. Thus, averaged unweighted rates that reflect variation across countries are preferable: These averaged rates are useful for purposes of modeling and estimation at regional and subregional levels. Such averaged values may also be used for estimation at the country level, for countries in a given subregion that lack data.
Demographic and Socioeconomic Characteristics
We linked retrospective calendar information on reported contraceptive failures that occurred during the five years preceding the survey with data from other sections of each woman’s individual interview. This linkage allows calculation of estimates of reported contraceptive failure stratified by demographic and socioeconomic characteristics. Data on age, parity, marital status, whether a method was being used to space births or to limit births (hereafter, contraceptive intention) were measured for each episode of method use. In contrast, data on education, wealth and urban-rural residence were measured only once, when women were interviewed, and may have changed during the period on which failure rates are based (see Box for more detail).
Measurement of Demographic and Socioeconomic Characteristics
Characteristics Measured for Each Episode of Use
Age, parity, marital status and contraceptive intention were measured at the time of each contraceptive discontinuation.§ Marital status during each episode of contraceptive use was measured by comparing the date of the end of the episode (i.e., contraceptive discontinuation) with the date of the woman’s (first) marriage. Each episode was then classified according to whether the woman was married (defined as formally married or living in a union) or had never been married at the time of discontinuation.** Measurement of these characteristics at the time of discontinuation introduces an additional complication for contraceptive episodes that continued beyond the period of estimation (be it month 12, 24 or 36), or that continued into the end of the observation period at three months before the interview. For these episodes, we measured age and marital status at the end of the relevant life table (month 12, 24 or 36) or at the time the observation was censored.††
Following the method of Lightbourne,19 we classified women's contraceptive intention for each episode of contraceptive use by comparing the number of children ever born to her with her ideal number of children from the question, "If you could go back to the time you did not have any children and could choose exactly the number of children to have in your whole life, how many would that be?" If a woman's ideal number of children was less than or equal to her actual number of children, she was assumed to have already achieved her ideal family size, and the episode was classified as use of contraception to limit births. All other episodes of use were classified as use to space births.‡‡ Note that this measure does not use information from the questions about future fertility intentions ("Would you like to have (a/another) child, or would you prefer not to have any (more) children?") that are used in calculations of unmet need for contraception, along with the question on retrospective fertility intentions for women who are pregnant or have postpartum amenorrhea,20 or that are used in other classifications of contraceptive users by fertility intentions.2 We followed the approach of Lightbourne instead because the comparison between current and ideal number of children can be recalculated at the beginning of each episode, whereas the questions about future fertility intentions refer only to women's preferences at the time of the survey.
Characteristics Measured Only at the Time of Interview
For some other characteristics—household wealth quintile,§§ women’s education level (no education or incomplete primary, complete primary, and secondary school or higher), and urban-rural residence—we applied information collected at the time of the survey interview to all of the woman’s episodes of contraceptive use. Although this approach may result in some misidentification (e.g., if women have become more educated or experienced substantial changes in asset ownership in the last five years), we assume that for the vast majority of women, current wealth, education and residence are reasonably representative of those measures they have had during the prior five-year period.
To capture interrelationships between demographic and socioeconomic characteristics, we also present contraceptive failure rates by combining pairs of these characteristics. For example, we examine failure rates by education (completed primary or less, secondary or higher) within wealth categories (poorest three quintiles, wealthiest two quintiles) to determine whether patterns of reported contraceptive failure by education differ among poorer versus wealthier women.
Methods
Statistical Approach
Single-decrement life tables estimate probabilities of cause-specific contraceptive discontinuation including contraceptive failure leading to a pregnancy, in the absence of competing reasons for discontinuation, such as stopping use because of an intention to become pregnant. Different populations may have widely varying levels of discontinuation for reasons other than failure; for example, women may stop use because of side effects or access issues. Differences in levels of discontinuation for other reasons can make multiple-decrement estimates, which calculate failure rates in the presence of other competing reasons for discontinuation, difficult to compare across populations. Single-decrement rates are helpful for comparing failure rates across multiple surveys or between subgroups; thus, we calculated single-decrement month-by-month life table rates in this exploration of contraceptive failure across multiple countries and demographic and socioeconomic groups. A detailed explanation of our methods for calculating failure rates and confidence intervals is given in Appendix A.
Contraceptive Methods Analyzed
For this report, we calculated contraceptive failure rates for seven methods: five modern methods (oral contraceptive pills, IUDs, injectables, implants and male condoms) and two traditional methods (periodic abstinence/rhythm method and withdrawal). Where possible, women who reported using fertility awareness methods (such as the Standard Days method or the TwoDay method) were classified as users of "other modern methods," as their numbers are too few to calculate failure rates. In some cases, however, the category of periodic abstinence users and their failure rates may include some women using these methods who were not identified as such through the survey.
Sampling Weights and Rules for Estimating Failure Rates
In all analyses, we used individual-level sampling weights to produce results that are nationally representative within each country to account for unequal selection probabilities in each survey’s sample design. (The unweighted numbers of contraceptive episodes contributing to each failure rate are shown in the Online Appendix Tables (See "Additional Downloads" list above).) To ensure reliability of contraceptive failure rates, we do not report any rates that were based on fewer than 125 episodes of contraceptive use (specifically, fewer than 125 unweighted episodes in month 1 of the life table, excluding late entries). Failure rates based on 125–249 episodes of use (during month 1 of the life table) are presented in parentheses in the tables and should be interpreted with caution.*† Numbers of episodes for each country and method are shown in Appendix Table 2.
To estimate failure rates for each method within an entire subregion, we pooled together all data for countries within that subregion, including those from countries with fewer than 125 episodes of use; again, results are presented only when the total number of episodes of contraceptive use from all countries in that subregion was at least 125. We produced pooled estimates of failure rates for all seven assessed methods in each subregion except for implants in Eastern Europe and Central Asia (where only six episodes of use were reported in the entire subregion). As described above, each country contributes equally to the pooled rate for a subregion and for all countries combined. We also used pooled data to calculate failure rates by demographic and socioeconomic characteristics.
We conducted all analyses in CSPro version 4.1.002 and produced graphics using StataMP 14.
Limitations
As noted earlier, the timing of the measurement of certain characteristics and the age of some of the surveys (particularly those in LAC) are analytic limitations. We used the most recent data available and present results for the largest number of countries possible, rather than exclude data from subregions such as LAC. Wealth, educational attainment and urban-rural residence were measured at the time of interview, rather than at the time of the episode of contraceptive use, which may have occurred up to five years earlier. If any of these variables had changed since that episode, contraceptive failure rates by these characteristics may be inaccurate.
We were unable to include episodes of contraceptive use that began before the calendar period started, because we did not know the duration of use for those episodes. A detailed description of how this limitation may affect our results is provided in Appendix A. In brief, it has a minimal impact on 12-month failure rates and may cause a slight overestimation in 24- and 36-month failure rates (more so for long-term methods), but is likely to have a small impact overall.
In collecting reproductive calendar data, women were asked to recall events that occurred up to seven years in the past, which has raised some concern that calendar data may be less reliable than current status data. Goldman, Moreno and colleagues8,21,22 demonstrated that DHS contraceptive calendar data were not subject to selection bias or attrition. Curtis and Blanc7 theorized that women can more accurately recall longer episodes of use, but may omit or incorrectly recall shorter episodes of use. We therefore expect information on longer-term methods, especially IUDs and implants, and to a lesser extent, pills and injectables, to be more accurately reported than that on shorter-term methods (condoms, periodic abstinence, withdrawal). Conversely, longer-term methods are more likely to be excluded from analysis than shorter-term methods because of missing information about the start and duration of use, as described in Appendix A. Reported durations of contraceptive use have been found to cluster somewhat at one, three, six and 12 months, but previous studies concluded that clustering was probably not severe enough to substantively affect estimates of discontinuation.7,15
A useful approach to assess the quality of retrospective calendar data is to compare the current status contraceptive prevalence (and method mix) with estimates based on retrospective calendar data, from two surveys conducted fewer than five years apart in the same country. Early analyses found these estimates to be nearly identical,7 or found calendar data to slightly underestimate contraceptive prevalence relative to current-status data.15 However, a more recent and comprehensive analysis using this approach found far greater underreporting of contraceptive use in the calendar than in the earlier studies.23 This underreporting was particularly pronounced in all Western African countries analyzed, but also present in most other Sub-Saharan African surveys and those from other subregions. Condom use appears particularly underreported in calendar data, and substantially so in more than half of surveys analyzed. Traditional and short-term modern methods also appear to be frequently underreported in calendar data in many surveys. If many episodes of use—particularly those ending in contraceptive failure—are underreported, failure rate estimates may not be reliable. On the basis of findings of Bradley et al.,23 failure rates presented in this report, particularly those from Asian and Sub-Saharan African countries, and especially from Western African countries, may be underestimated and should be interpreted with caution.
Even if contraceptive use and discontinuation are reported accurately, contraceptive failure may still be underreported. Women who experienced a failure leading to an unintended pregnancy may, because of social desirability bias, instead report that they discontinued use in order to become pregnant, or may give a different reason for doing so. Such misclassification of the reason for discontinuation would bias failure rates downward. Omission of episodes of use that ended in failure could have the same effect. On the other hand, it has been argued that women may overreport contraceptive use at the time they became pregnant out of social desirability bias. If true, the resulting overestimate may offset at least some of the underestimate associated with a lack of reporting of failures that result in unintended pregnancies or abortions.12
A further source of underestimation results from stigma around abortion, leading to underreporting of contraceptive failures that result in abortion. Pregnancy terminations, particularly induced abortions, are generally underreported in surveys, including DHS surveys and surveys in countries with liberal abortion laws such as United States.9,24,25 However, the degree of stigma and underreporting may vary across countries. For example, countries in the Eastern European and Central Asian subregions, as well as two in the Northern African and Western Asian subregion (Armenia and Azerbaijan) have liberal abortion laws and relatively low abortion stigma. Therefore, women in these areas may be less likely to underreport abortion, leading to a relatively smaller impact of underreporting on failure rates than in other countries. We are unable to estimate the impact on failure rates of omission, misreporting and underreporting of contraceptive use episodes, reasons for discontinuation, and abortions resulting from contraceptive failure. Bradley et al.15 investigated the potential impact of misreporting reasons for discontinuation by reclassifying episodes of use that ended in a pregnancy as failures even if women gave a different reason for discontinuation. They found this type of misclassification may occur, but the impact on failure rates is likely relatively small.
Because of the limitations described, the failure rates presented here should be viewed as direct reflections of women’s reports, which are potentially affected by a number of biases and may not accurately reflect women’s actual contraceptive histories and contraceptive failures. Despite these limitations, our data contribute to a better understanding of contraceptive failure rates over time and across populations, which can provide important insights and help to improve the effectiveness of contraceptive use.
Background and Context
Contraceptive use and failure occur within the larger context of women's lives. This chapter presents selected national demographic and socioeconomic indicators for the 43 countries included in this report, to provide context for our estimates of contraceptive failure rates. It also presents selected measures of sexual and reproductive behaviors of women in these countries.
Demographic and Socioeconomic Indicators
Gross national income per capita varies greatly across the included countries, but overall, is relatively low (Table 1). In fact, the majority of these countries are among the 69 poorest globally, as classified by Family Planning 2020 (FP2020). Gross national income per capita is lowest for those in Sub-Saharan Africa (generally less than US$1,000) and highest for those in Latin America and the Caribbean (LAC), Northern Africa and Western Asia on the basis of data from 2013. There is marked variation across countries, ranging from US$260 for Burundi to US$12,550 for Brazil.
At the subregion level, the proportion of women age 15–49 living in urban areas is generally highest in LAC, ranging from 45% in Honduras to 82% in Brazil. Secondary or higher education is almost universal for women in this age-group in the Eastern Europe and Central Asia subregion and in Western Asia, whereas proportions are relatively low in Eastern and Western Africa.
Sexual and Reproductive Behaviors
Marriage and Sexual Activity
The proportion of women 15–49 who were ever married (married or in union) in the 43 countries ranges from a low of about 57% in Jordan and Morocco to a high of 92% in Niger; most countries fall within the range of 67–80% (Table 2). The proportion of unmarried women who are sexually active, meaning they had intercourse in the past three months, is also relevant in terms of measuring the extent of exposure to risk of pregnancy and potential need for effective contraceptive use. However, some countries did not interview unmarried women,*‡ and others that did had data of questionable quality. Among the 28 countries having data of acceptable quality and regardless of marital status, the proportion of unmarried women who are sexually active ranges from 2% in Ethiopia and the Philippines to 44% in Columbia.
Fertility Level and Preferences
Attainment of fertility goals can be assessed by comparing the number of children women want, the wanted total fertility rate (TFR), with the number they already have, the actual TFR. A smaller gap in this measure implies that a country is closer to achieving its fertility goals. The magnitude of the difference between the wanted and actual TFRs varies considerably in the countries studied, from a difference of 0.1 children in Armenia, Kazakhstan and Ukraine, to a difference of 2.1 in Bolivia (Table 2). By subregion, unweighted average differences between actual and wanted TFR range from 0.2 in Eastern Europe and Central Asia to 1.1 in Eastern Africa (data not shown). Where the wanted TFR is very low (e.g., less than 2.5), and where the gap between the two measures is moderate or large (e.g., 0.5 or greater), motivation to use contraception effectively is likely to be very high. The proportion of married women in Eastern and Western Africa who reported that they wanted to wait at least two years before having a child or another child (which we treat as wanting to space births) ranges from 34% to 56%, higher than in most other subregions.
The proportion of married women wanting no more children ranges from 9% to 53% in Eastern and Western Africa, and from 44% to 75% in other subregions (with the exception of the Kyrgyz Republic at 26%), indicating that smaller shares of women have completed childbearing in Eastern and Western Africa as compared with other subregions. Differences among countries and subregions in the proportion wanting to space the next birth compared with the proportion wanting to have no more children may be related to contraceptive failure rates. Women who want to stop childbearing and are using contraception are more highly motivated to use their method effectively than peers who want to delay childbearing or space the next birth.
Access to Health Care
In most countries, more than 75% of women who gave birth recently reported receiving skilled antenatal care, meaning care from a doctor, nurse or midwife (Table 2). This indicator of access to basic health care is presented as a proxy for access to facility- and provider-based contraceptive services. Countries with relatively low levels of receipt of antenatal care—Ethiopia (where just 28% of women received such care), Bolivia (53%), Bangladesh (55%), Nepal (59%), Guatemala (60%), Nigeria (61%) and Morocco (68%)—may have higher failure rates for modern methods, as women and couples in those countries are more likely on average to obtain their methods directly from drug sellers and not receive proper counseling or follow-up care regarding use.
Contraceptive Prevalence and Method Mix
The prevalence of contraceptive use and the methods chosen vary considerably across the 43 countries assessed (Table 3). It is important to note that survey dates may have implications for the comparisons below; for example, if a particular method was scaled-up after the survey date, levels of use may be higher than reported here.
Overall contraceptive prevalence among all women 15–49 at risk for pregnancy (all those who are married as well as those who are unmarried and sexually active) ranged from 13% in Senegal to 79% in Viet Nam. By subregion, contraceptive prevalence varied widely, and was extremely low in Western African countries (range, 13–19%) and low in Eastern African countries (14–58%). It was somewhat higher in countries in Eastern Europe and Central Asia (28–69%) and Southern Asia (35–61%), and generally the highest in LAC (38–77%), Southeastern Asia (49–79%), and Northern Africa and Western Asia (51–72%).
Patterns of use of modern versus traditional contraceptive methods can also be informative. We defined the following to be modern methods: male and female sterilization; implants; IUDs; injectables; oral contraceptive pills; male and female condoms; diaphragms; foam, jelly and spermicides; Standard Days Method; emergency contraception; fertility wheel calculator; and the Mucus/Billings/Basal body/Symptothermal method. Not all of these methods were asked about in all surveys. We defined the following to be traditional methods: periodic abstinence (calendar rhythm); withdrawal; Lactational Amenorrhea Method (LAM); and other traditional, local or folk methods. Of note, as LAM is self-reported by women, it may be confused with simple breastfeeding. A recent study of 78 Demographic Health Surveys found that on average, only 26% of women who reported using LAM met all three criteria for this method (postpartum amenorrhea, fully or exclusively breastfeeding, and having an infant younger than six months old).26
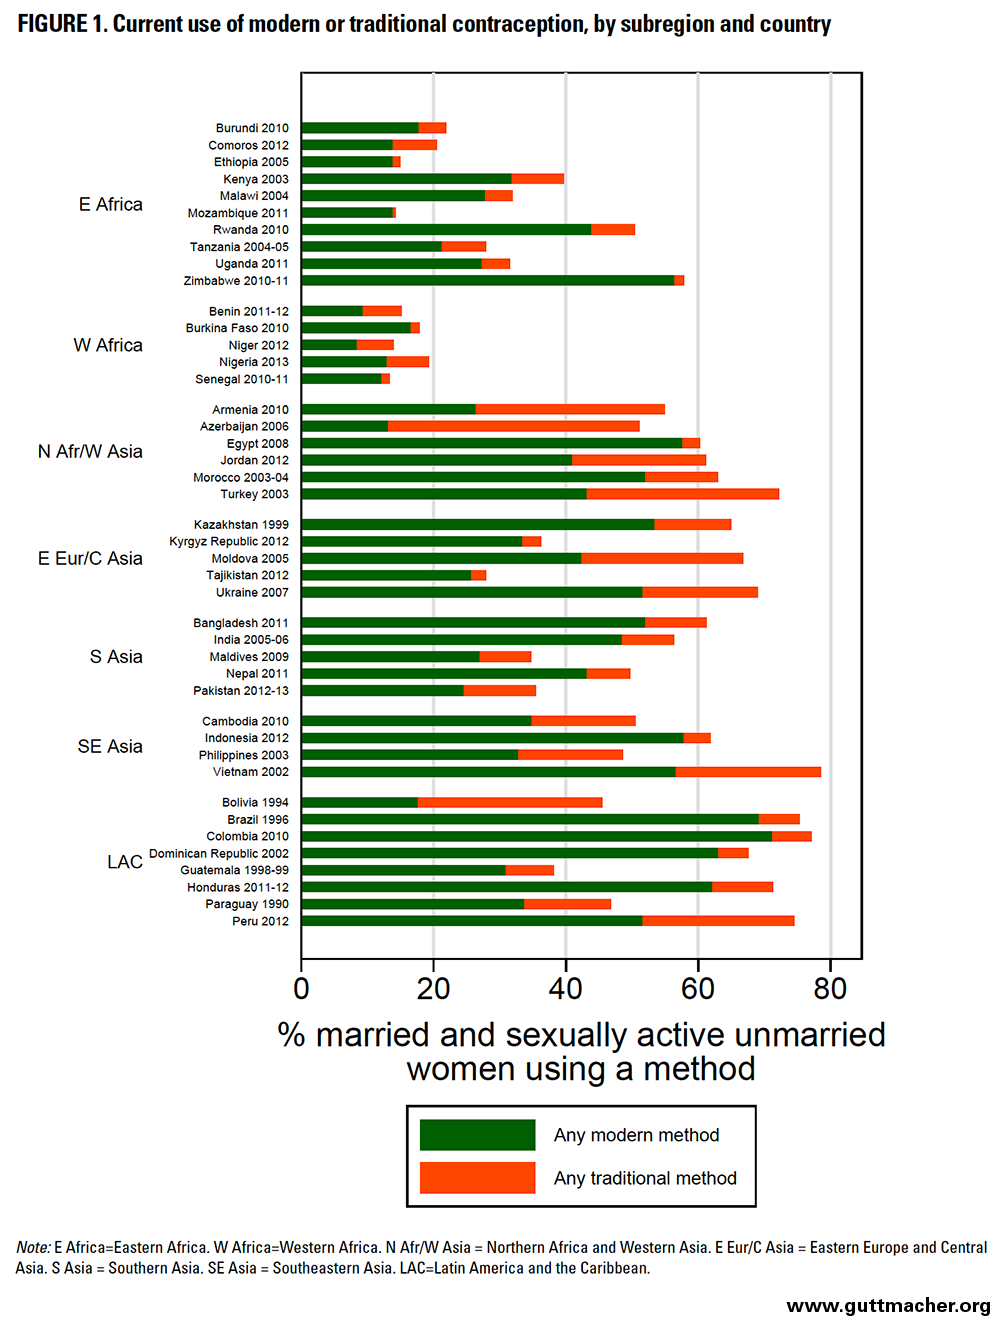
As failure rates vary by type of contraceptive method, their overall importance and implications for a particular country will depend on its contraceptive method mix. Specifically, where the proportion of women using less effective methods is greater, those of reproductive age will overall be more vulnerable to method failure and unintended pregnancy. For example, although Northern Africa and Western Asia have a relatively high overall contraceptive prevalence, a substantial proportion of users rely on traditional methods (particularly withdrawal); in contrast, in Western Africa, overall contraceptive prevalence is low, but most users rely on modern methods (Table 4 and Figure 1).
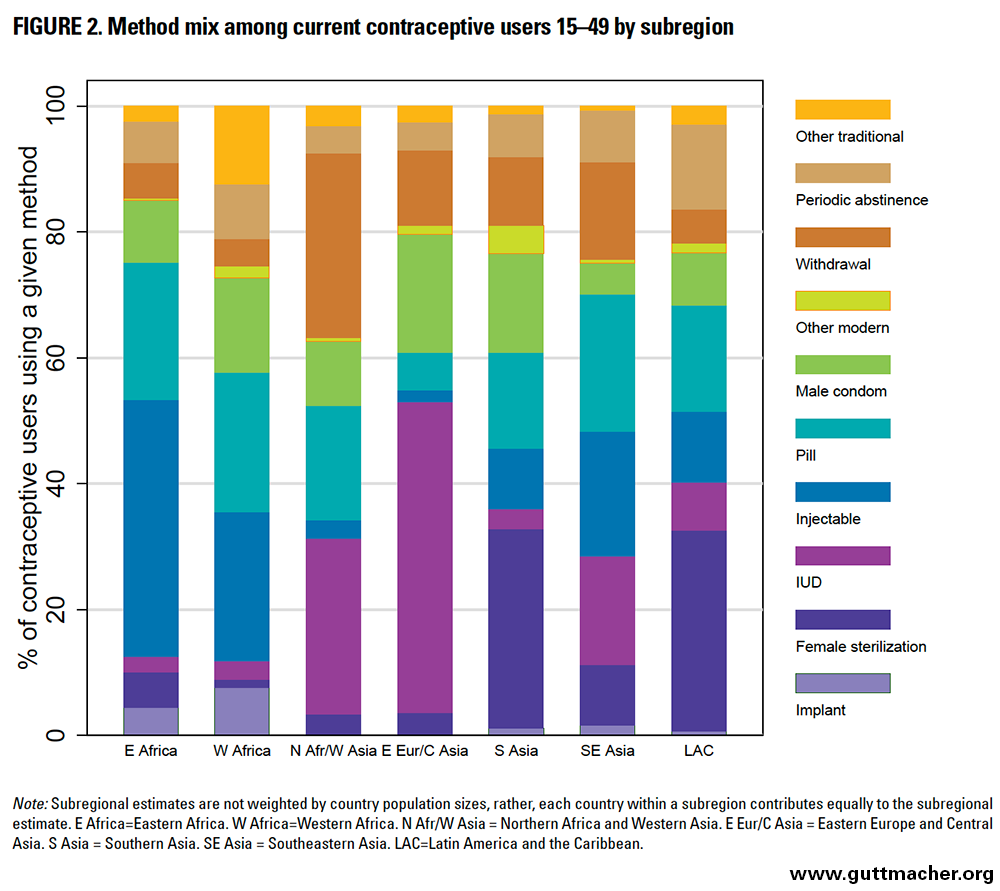
Method mix varies considerably among subregions (Table 4 and Figure 2). Implant use is low in most countries, but accounts for a relatively larger proportion of total use in Eastern and Western Africa (and was particularly high in Rwanda and Burkina Faso). Female sterilization is common in Southern Asia and LAC; in five countries (India, Nepal, Brazil, Dominican Republic and Guatemala), it is used more commonly than any modern reversible methods. IUDs constitute a major share of contraceptive use in Eastern Europe and Central Asia and in Northern Africa and Western Asia. Injectable contraception accounts for more than 30% of all contraceptive method use in the majority of countries in Sub-Saharan Africa, and a substantial share in Southeastern Asia as well (particularly Indonesia). Use of the oral contraceptive pill was more proportionally consistent across subregions, but was particularly prevalent in two countries, Zimbabwe and Morocco. The proportion of contraceptive users relying on male condoms ranged from less than 1% in Niger to 42% in Ukraine. Use of withdrawal was most notable in Western Asia (particularly Azerbaijan, Turkey and Armenia), while the prevalence of periodic abstinence use was variable; constituting less than 10% of contraceptive use in most (33) countries, with a notable exception in Bolivia, where it constituted nearly 50% of contraceptive use.
Overall and Subregional Contraceptive Failure Rates
In this chapter, we present the 12-, 24-, and 36-month failure rates by contraceptive method and highlight key findings. Findings are discussed for the 43 countries overall and for each subregion; information for individual countries is given in the accompanying tables.
Overall Method-Specific Contraceptive Failure Rates (Medians)
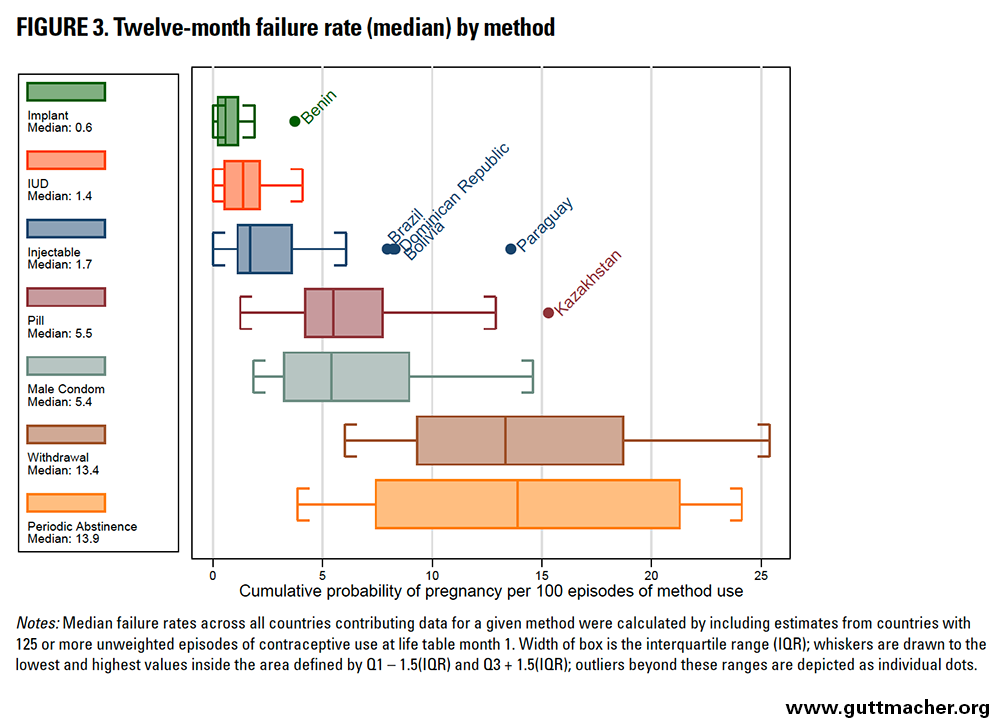
As expected, modern contraceptive methods with the least room for user error had the lowest median failure rates and the lowest variability in these rates (Table 5 and Figure 3). The overall 12-month median failure rate for every 100 episodes of method use was 0.6 for implants (with a median of 95% confidence intervals for all included countries, hereafter, median 95% confidence interval, of 0.0–2.4), 1.4 for IUDs (0.0–2.4) and 1.7 for injectables (0.6–2.9). The rate for implants in Benin was an outlier at 3.7, but was based on fewer than 250 unweighted episodes of contraceptive use, and should be interpreted with caution. Injectable failure rates in Paraguay, Bolivia, Dominican Republic and Brazil were also unexpectedly high, at 13.6, 8.3, 8.2 and 8.0, respectively. However, these estimates are based on somewhat older data, it is possible that one-month injectables were available in at least some LAC countries, and the 12 month injectable failure rate estimates in both Benin and Bolivia were based on fewer than 250 unweighted episodes (Appendix Table 2).
Oral contraceptive pills and condoms had higher failure rates than implants, IUDs and injectables. The median 12-month failure rate for every 100 episodes of method use was 5.5 (median 95% CI, 3.5–7.3) for oral contraceptive pills and 5.4 (2.3–8.7) for male condoms. The rate for oral contraceptive pills in Kazakhstan was an outlier at 15.3; that country also had some of the highest failure rates for other methods, including IUDs, male condoms, periodic abstinence and withdrawal.
Contraceptives typically considered to be traditional methods, including withdrawal and periodic abstinence, had the highest failure rates and the greatest variability. The median 12-month failure rate for every 100 episodes of use was 13.4 (median 95% CI, 9.1–17.1) for withdrawal and 13.9 (9.2–19.3) for periodic abstinence.
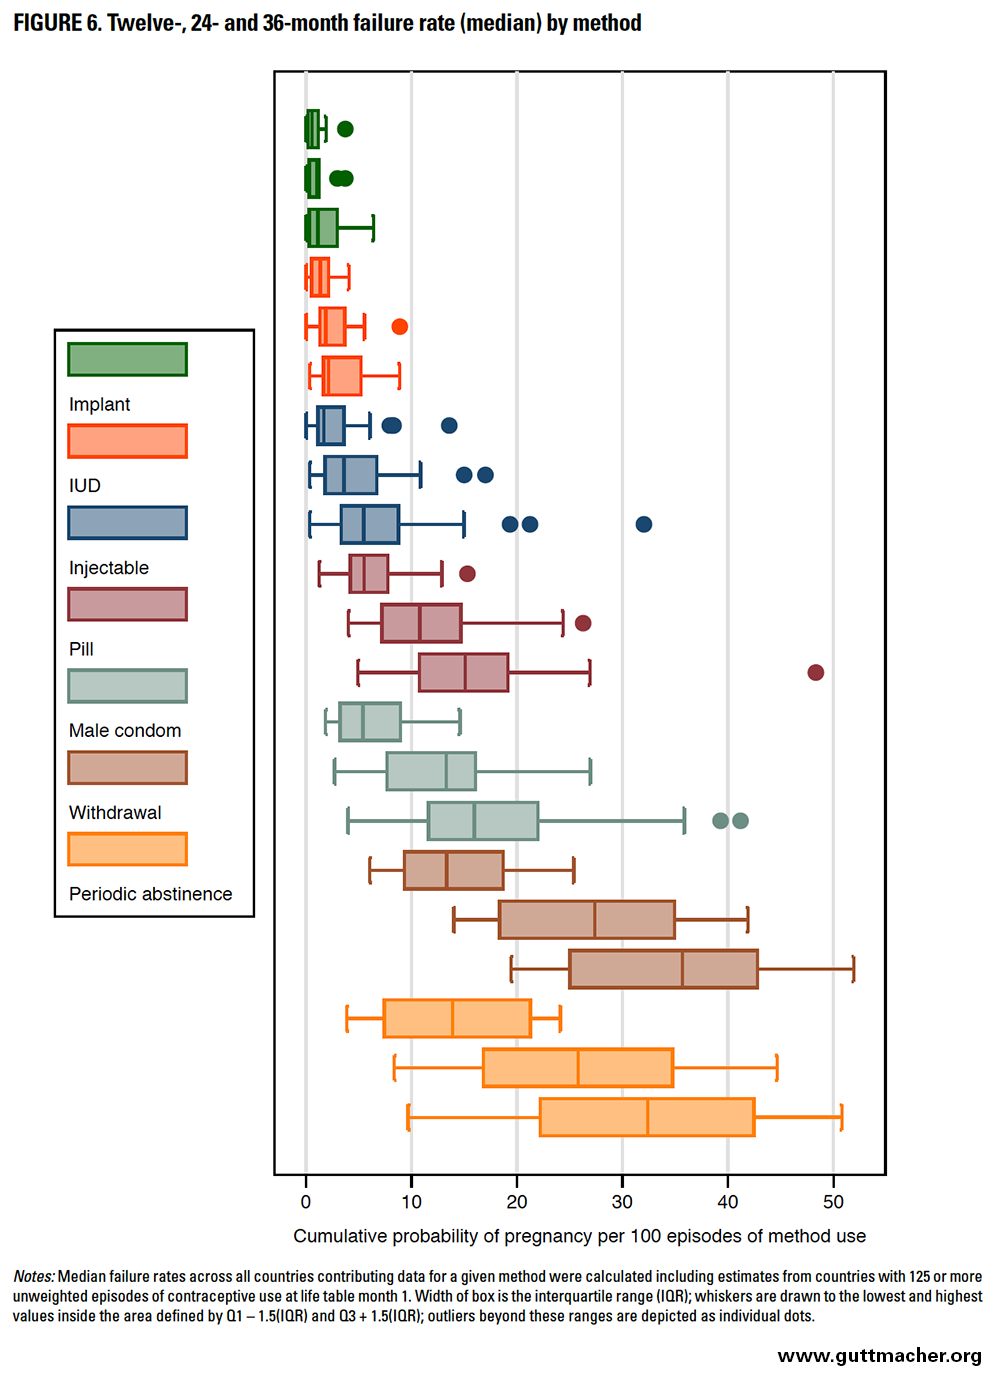
Figures 4 and 5 depict failure rates for each method across the 43 countries at 24 and 36 months, respectively. Data for individual countries are shown in Table 6, and results are described in greater detail below.
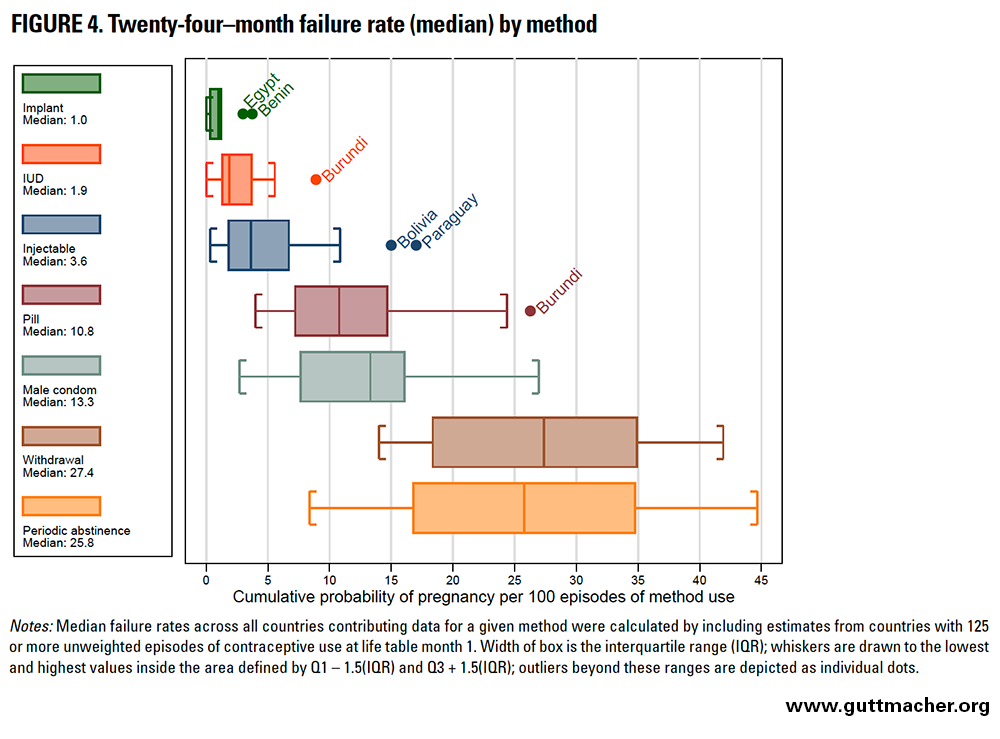
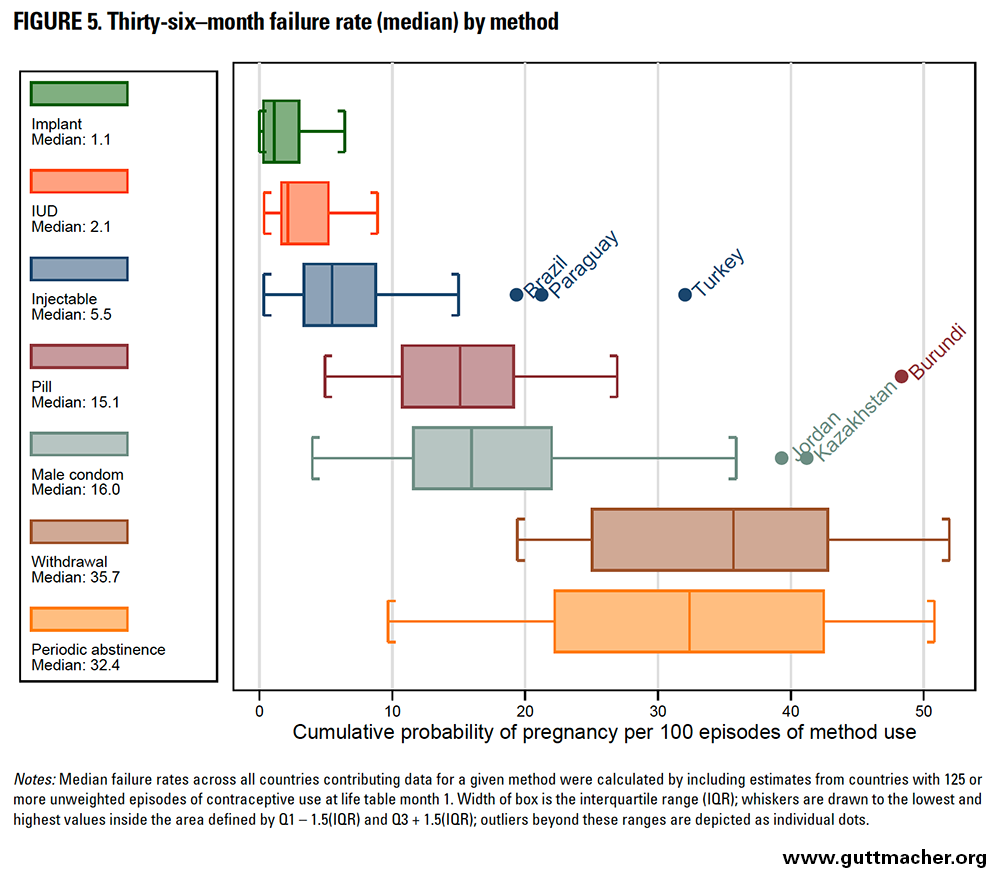
Contraceptive methods with lower failure rates had less variation around the median rate at any given duration of use (Figure 6). Failure rates are cumulative (i.e., they can only increase from the first to second year, or from the second to third year of use), but the magnitude of increase over time is smaller for longer-acting, user-independent methods and larger for user-dependent methods (Table 7). For example, the magnitude of increase in failure rates between 12 and 36 months was 0.5 for implants but 22.3 for withdrawal. It was generally larger earlier in use (i.e., between 12 and 24 months) than later in use (i.e., between 24 and 36 months). This pattern is probably due to selection: Women most likely to experience pregnancy from a contraceptive failure (i.e., the most fecund and those with highest levels of incorrect or inconsistent use) are removed from the population at risk over time.
Subregional Method-Specific Contraceptive Failure Rates (Pooled Estimates)
For each method, we calculated subregional failure rates at various durations of use (12, 24 and 36 months) by pooling country data. As previously noted, these findings should be interpreted as averages across populations in the countries analyzed and cannot be considered representative of the subregion (given uneven distribution of populations as well as incomplete representation of countries in a given subregion). Also, there are concerns about the quality of calendar data in certain subregions, particularly Western Africa, so these estimates should be interpreted with caution. We did not conduct formal significance testing, but the confidence intervals shown provide an informal sense of whether differences in estimates between methods or other subgroups are likely to be statistically significant.*§
Implants
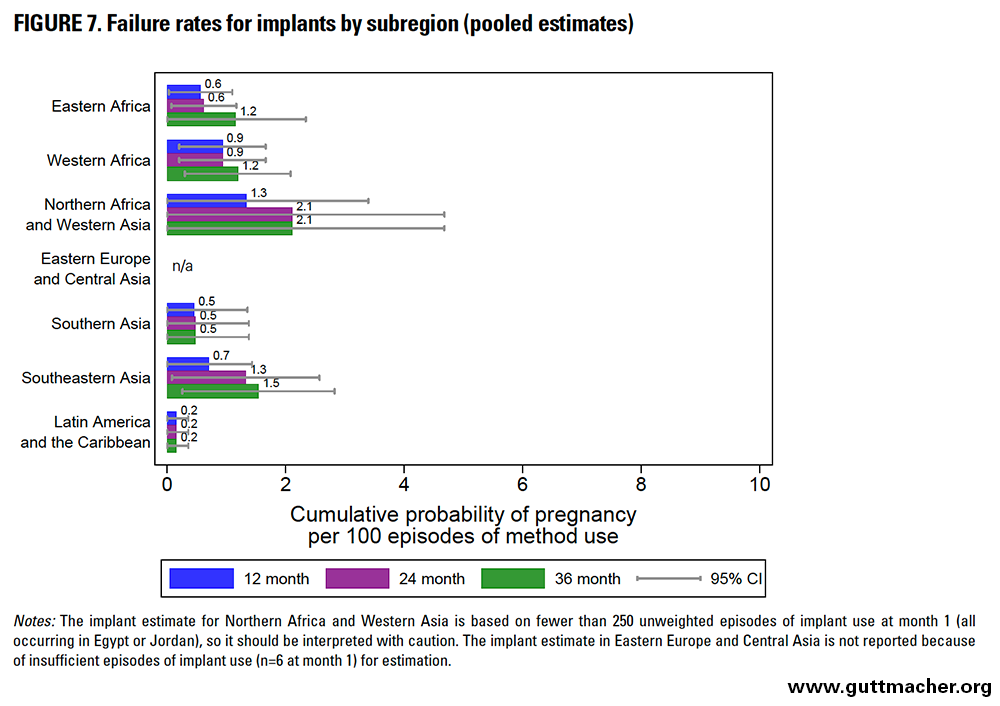
Across subregions, the 12-month failure rates for implants ranged from 0.2 to 1.3 per 100 episodes of use (Figure 7 and Table 8). The lowest were seen in LAC, whereas the highest were seen in Northern Africa and West Asia. Failure rates across subregions ranged from 0.2 to 2.1 at both 24 months and 36 months.
Intrauterine Devices
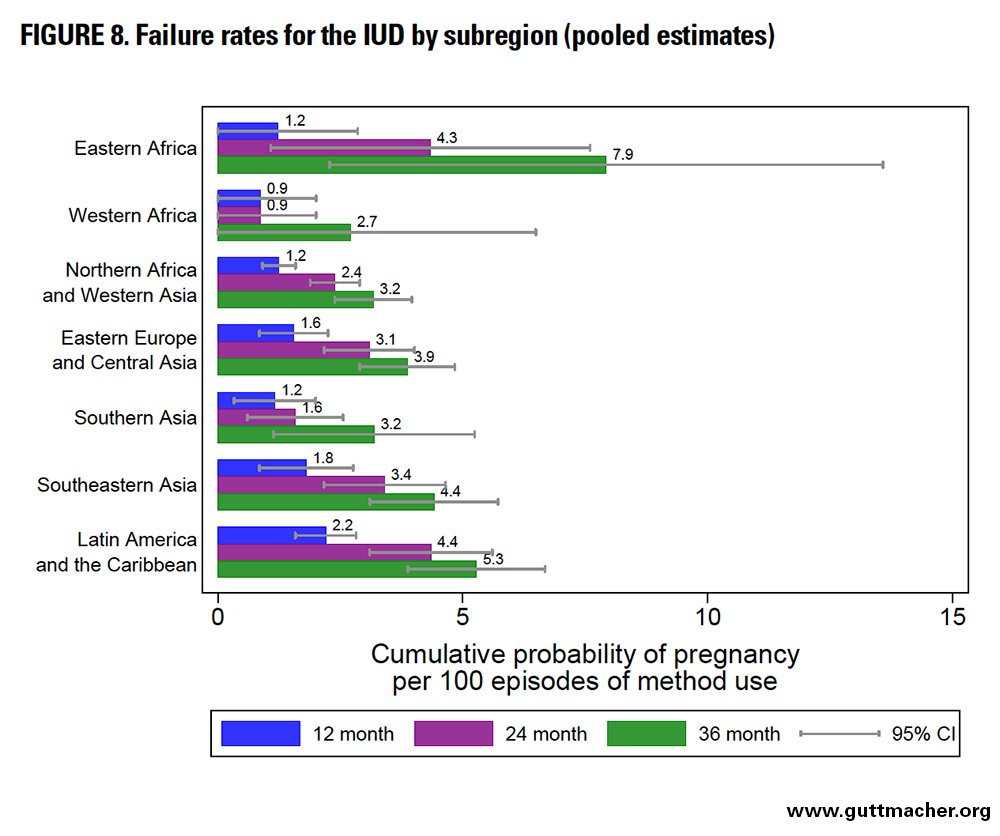
Across subregions, the 12-month failure rates for the IUD ranged from 0.9 to 2.2 per 100 episodes of use (Figure 8 and Table 8). The lowest were seen in Western Africa (but should be interpreted with particular caution) and Southern Asia, whereas the highest were seen in LAC. Failure rates across subregions ranged from 0.9 to 4.4 at 24 months and from 2.7 to 7.9 at 36 months, with particularly high values seen in Eastern Africa at these time points.
Injectables
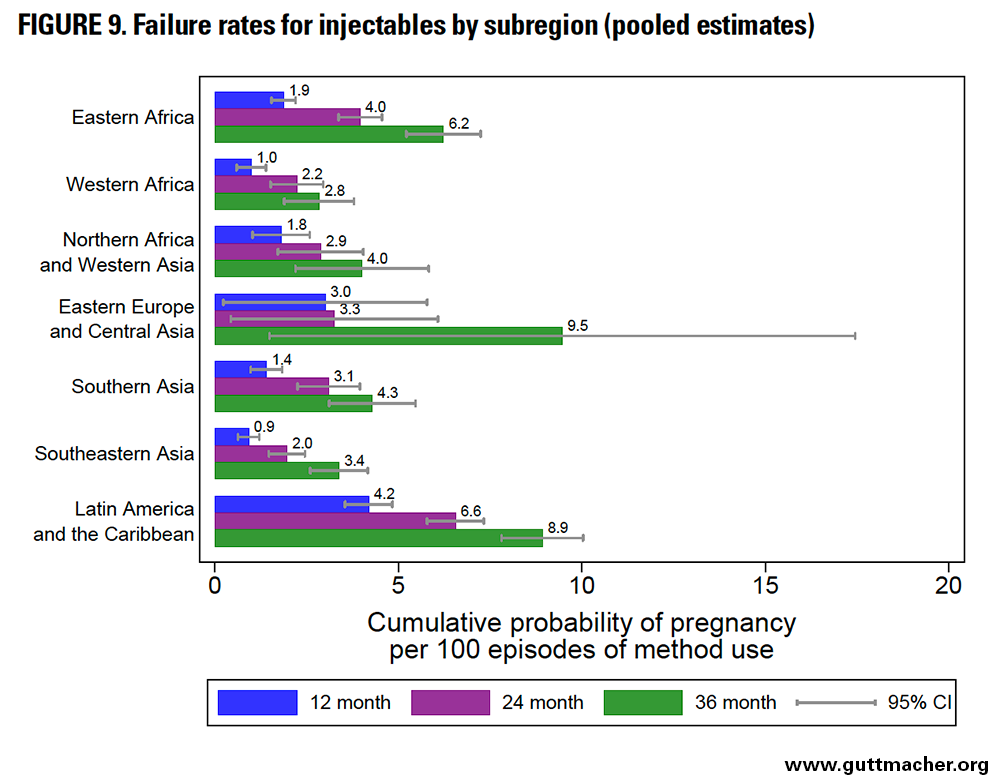
Across subregions, the 12-month failure rates for injectables ranged from 0.9 to 4.2 per 100 episodes of use (Figure 9 and Table 8). The lowest were seen in Southeast Asia, whereas the highest were seen in LAC. Unexpectedly, failure rates for injectables and IUDs were not dissimilar. Failure rates across subregions ranged from 2.0 to 6.6 at 24 months and from 2.8 to 9.5 at 36 months.
Oral Contraceptive Pills
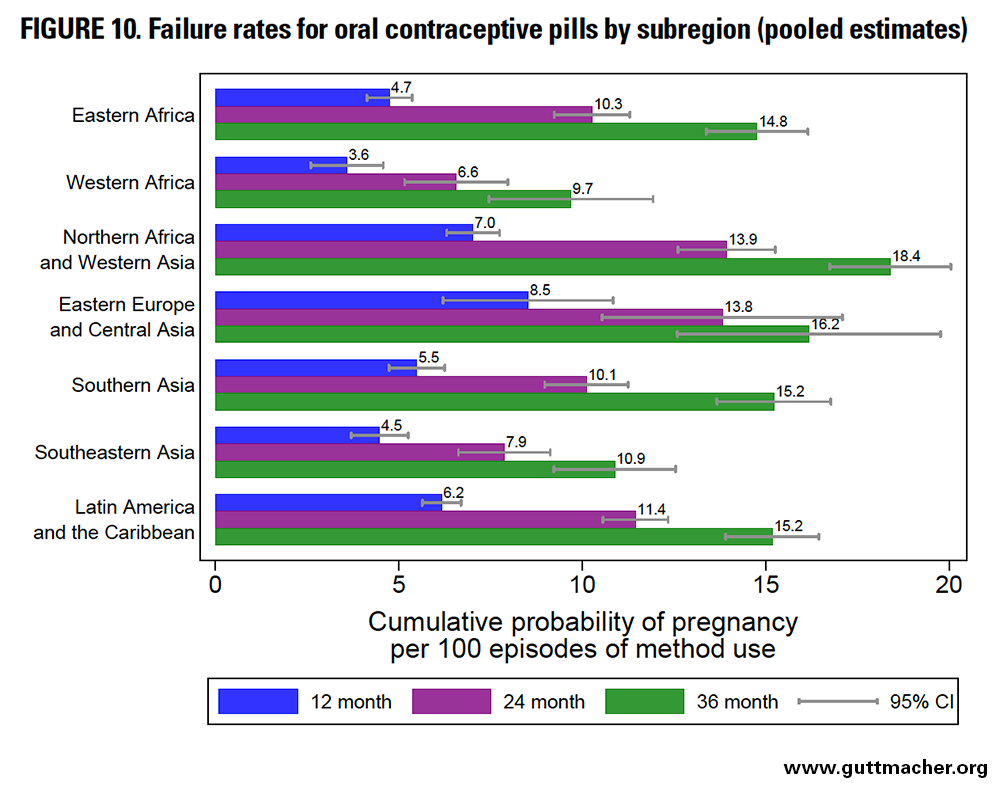
Across subregions, the 12-month failure rates for oral contraceptive pills ranged from 3.6 to 8.5 per 100 episodes of use (Figure 10 and Table 8). The lowest were seen in Western Africa (but should be interpreted with particular caution), whereas the highest were seen in Eastern Europe and Central Asia, and in Northern Africa and Western Asia. Failure rates across subregions ranged from 6.6 to 13.9 at 24 months and from 9.7 to 18.4 at 36 months.
Male Condoms
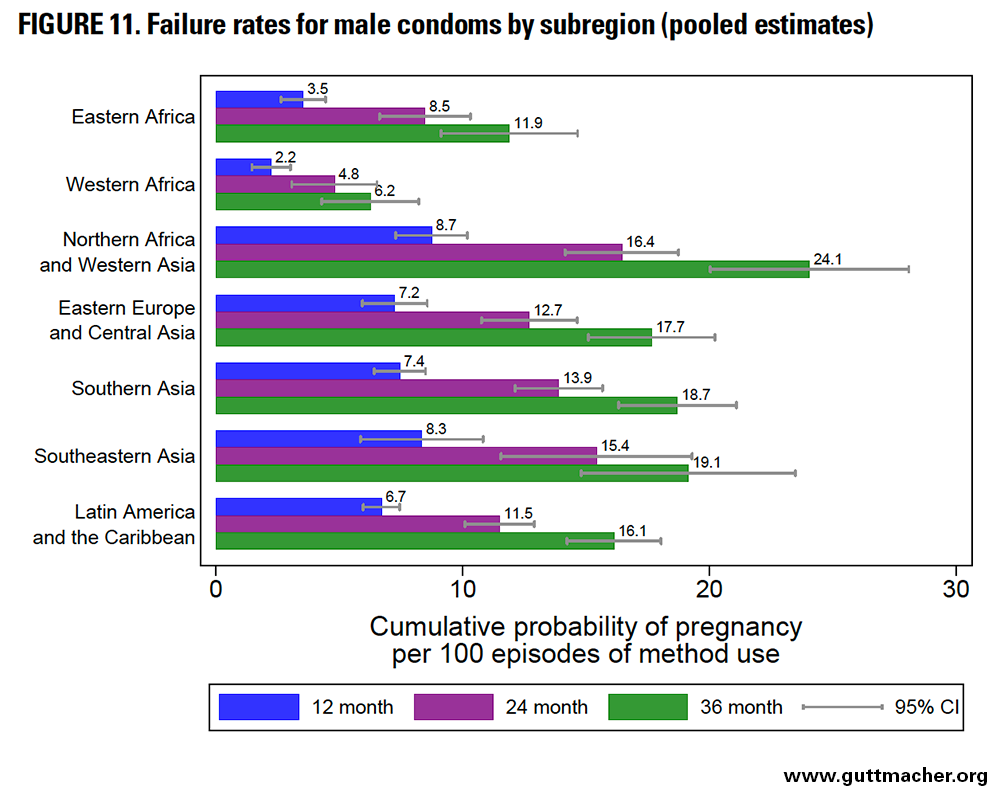
Across subregions, the 12-month failure rates for condoms ranged from 2.2 to 8.7 per 100 episodes of use (Figure 11 and Table 8). The lowest were seen in Western Africa (but should be interpreted with particular caution), whereas the highest were seen in Northern Africa and Western Asia. Failure rates across subregions ranged from 4.8 to 16.4 at 24 months and from 6.2 to 24.1 at 36 months.
Withdrawal
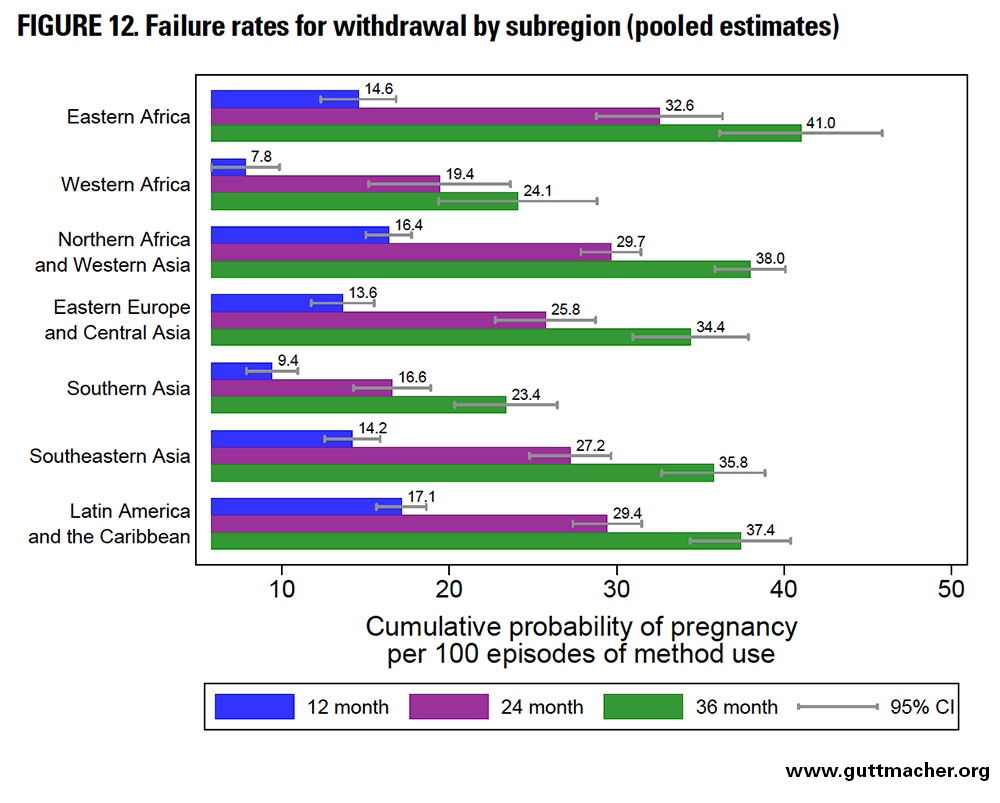
Across subregions, the 12-month failure rates for withdrawal ranged from 7.8 to 17.1 per 100 episodes of use (Figure 12 and Table 8). The lowest were seen in Southern Asia and Western Africa (but these estimates should be interpreted with particular caution), whereas the highest were seen in Northern Africa and Western Asia, and in LAC. Failure rates across subregions ranged from 16.6 to 32.6 at 24 months and from 23.4 to 41.0 at 36 months.
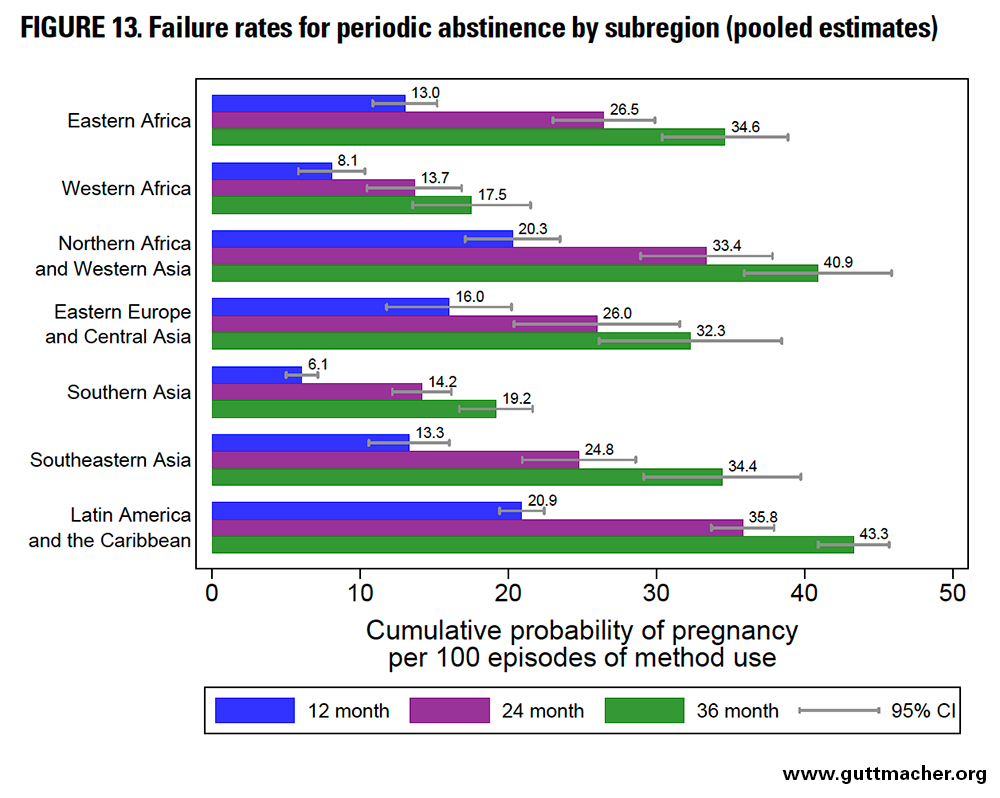
Periodic Abstinence
Across subregions, the 12-month failure rate for periodic abstinence ranged from 6.1 to 20.9 per 100 episodes of use (Figure 13 and Table 8). The lowest rates were seen in Southern Asia, whereas the highest were seen in Northern Africa and Western Asia, as well as in LAC. Failure rates across subregions ranged from 13.7 to 35.8 at 24 months and from 17.5 to 43.3 at 36 months.
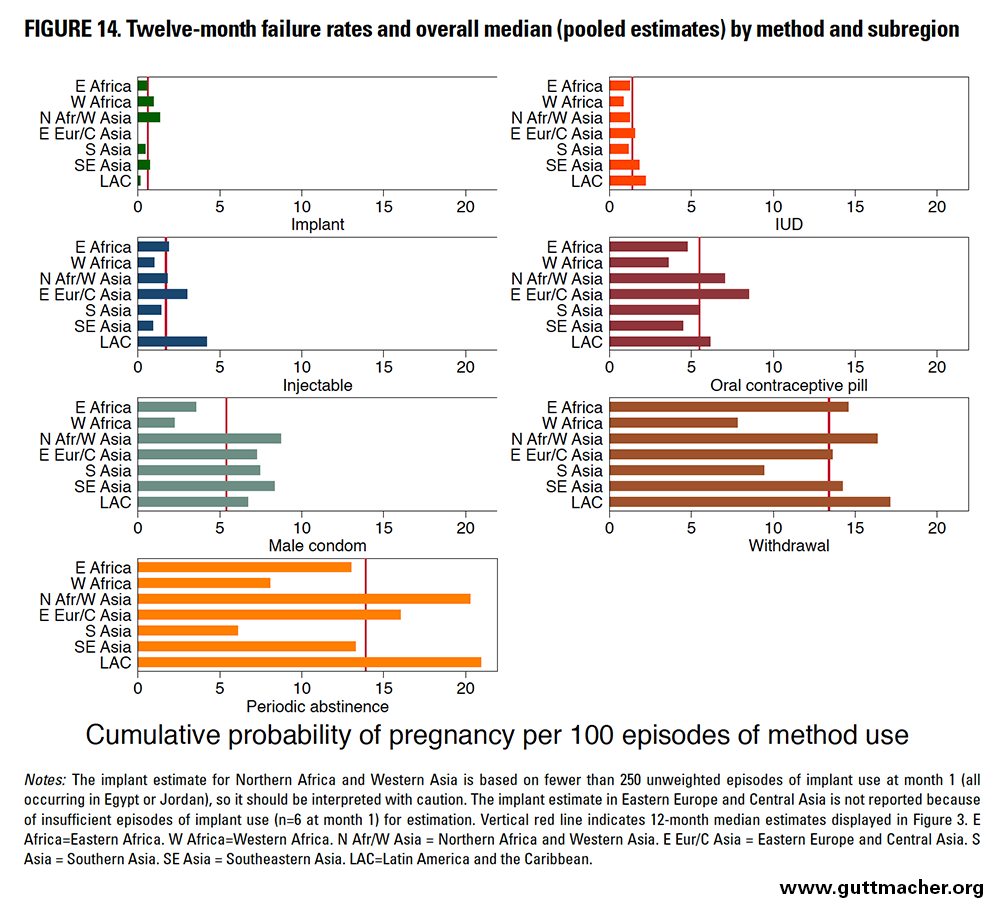
Pooled 12-month failure rates for all methods, by subregion
When 12-month failure rates for each method are compared across subregions, Western Africa had among the lowest rates for four of the seven methods assessed: oral contraceptive pills, IUDs, male condoms and withdrawal (Figure 14 and Table 8), but estimates from this sub-region should be interpreted with particular caution. On the other hand, LAC had among the highest failure rates for four of the seven methods: IUDs, injectables, periodic abstinence and withdrawal.
Contraceptive Failure Rates by Demographic and Socioeconomic Characteristics
Assessing failure rates among demographic and socioeconomic groups is important to inform efforts to improve contraceptive information, services and use, and to minimize contraceptive failures. For example, understanding which subgroups have the highest failure rates can allow contraceptive programs and service providers to better identify those clients who may require more assistance to effectively use their chosen method. In turn, this information can serve as a starting point to illuminate how to better assist specific groups, for example, by focusing on enhancing consistency of supply availability if contraceptive failures are high among clients who are likely to face cost or access issues, or by improving counseling of contraceptive clients with high failure rates that may be related to motivational factors such as their contraceptive intention (i.e., whether they are using a method to space births versus limit births).
In this chapter, we describe findings for 12-month failure rates, pooled across all 43 included countries (with each country equally weighted),*** by contraceptive method and population subgroup.*†† Pooling data across countries provides sufficient sample sizes to assess failure rates (for all included countries, as well as for subregion) for each contraceptive method by various demographic and socioeconomic characteristics, as well as by combinations of those characteristics. Detailed information for subregions is given in Tables 9 and 10. We did not conduct formal significance testing, but the confidence intervals shown in the figures and tables provide an informal sense of whether differences in estimates between methods or other subgroups are likely to be statistically significant.
Twelve-Month Contraceptive Failure Rates By Single Characteristics (Pooled Estimates)
Age
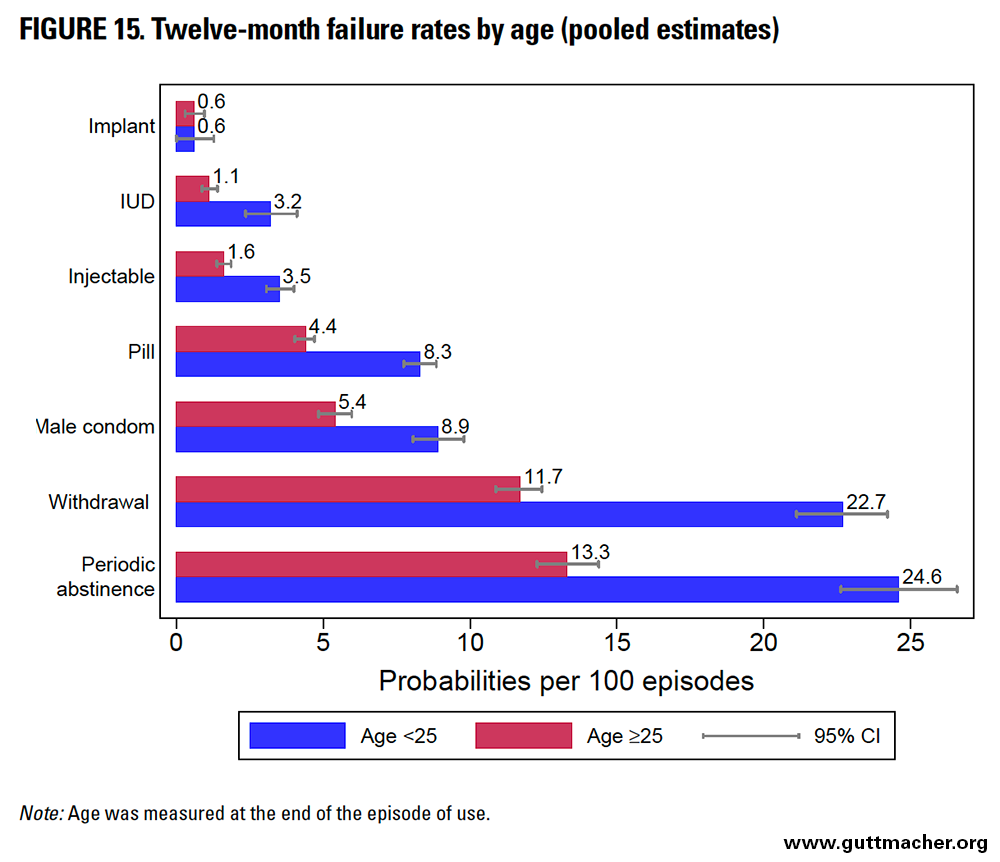
Across all methods, 12-month contraceptive failure rates were significantly higher among younger women (those younger than 25) than among older peers, except for implant users, who had no difference by age (Table 9 and Figure 15). This pattern generally held across most subregions except Western Africa, where older women had higher or slightly higher failure rates for implants, pills, male condoms and periodic abstinence. The absolute differential in the failure rate by age exceeded 10 percentage points among users of traditional methods such as withdrawal or periodic abstinence, although the relative difference was largest for IUD users, with younger users 2.8 times more likely to experience a contraceptive failure than older counterparts.
Marital Status
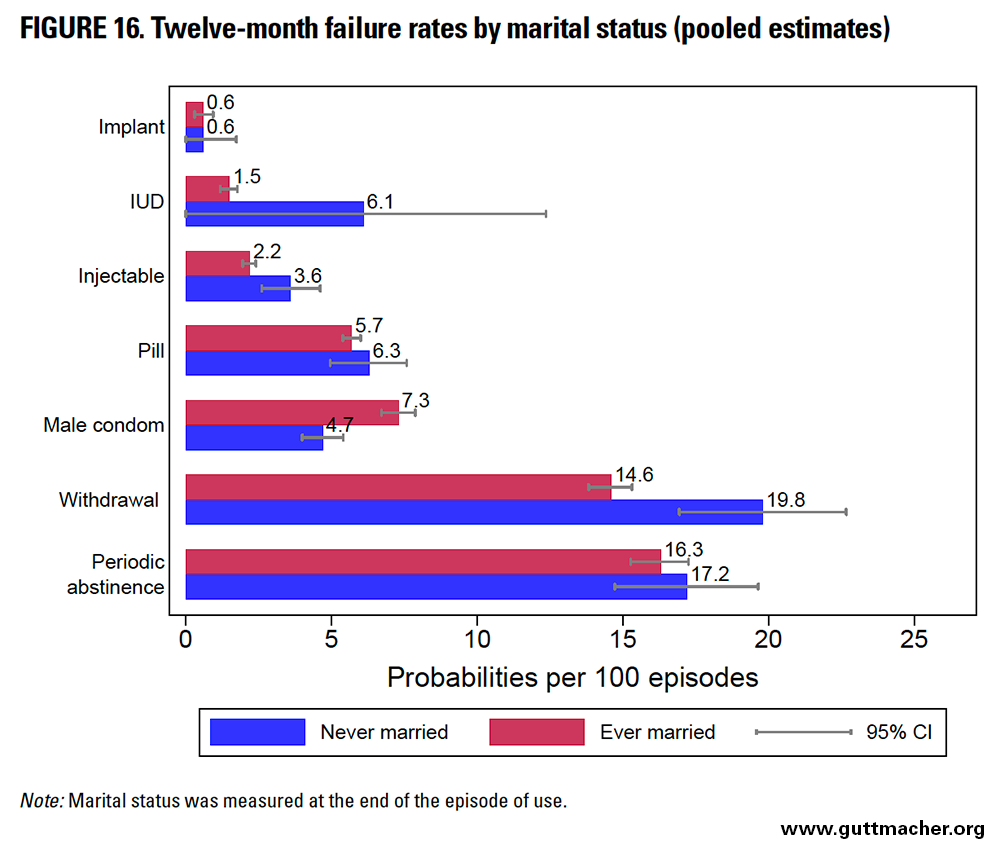
Ever-married women had similar or lower 12-month failure rates than never-married counterparts for most contraceptive methods, except for condoms, for which this pattern was reversed (Table 9 and Figure 16).*‡‡ The absolute differential in rate by marital status was largest (5.2 percentage points) among users of withdrawal. The relative difference was largest among IUD users (with never-married users 4.1 times more likely to report a contraceptive failure than ever-married peers). However, estimates for never-married women for IUDs were based on 384 episodes of use, and therefore had wide confidence intervals that overlapped those of ever-married women.
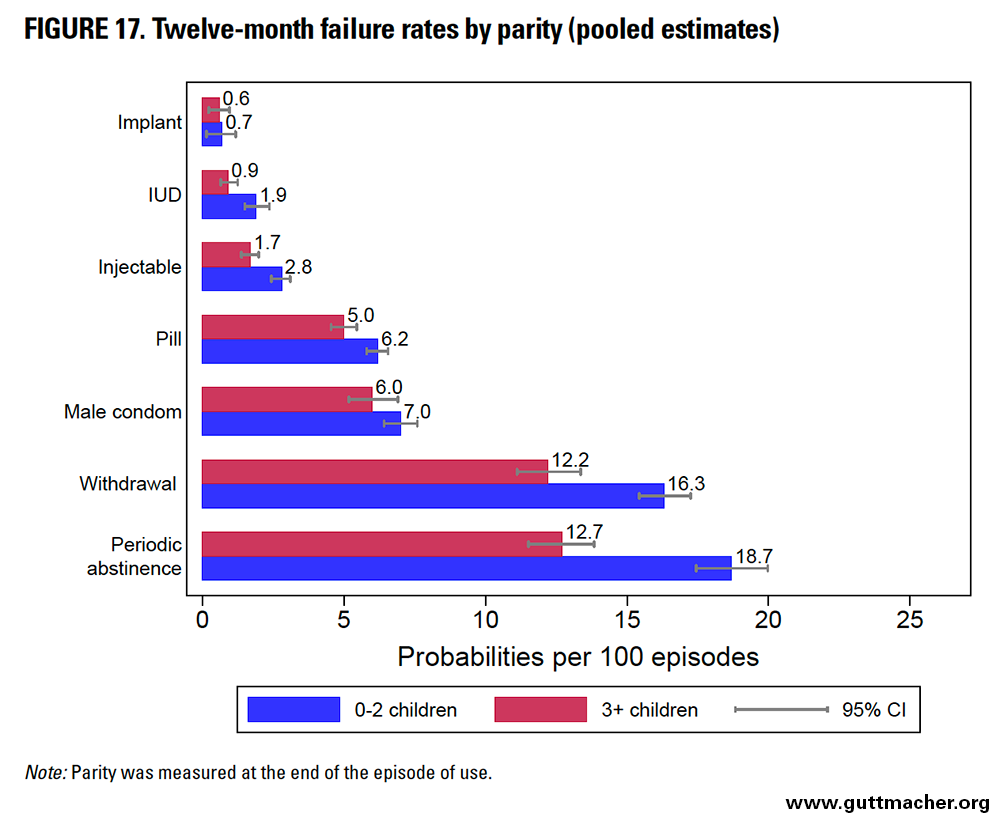
Parity
Across all methods, 12-month contraceptive failure rates among lower-parity women (having 0–2 children) exceeded those among higher-parity counterparts (Table 9 and Figure 17), although the gap was small for implant users, and confidence intervals overlapped substantially for condom users. Periodic abstinence users reported the largest absolute differential in failure rates by parity (6.0 percentage points). IUD users reported the largest relative differential by parity; lower-parity women had double the risk of IUD failure as higher-parity peers.
Contraceptive Intention
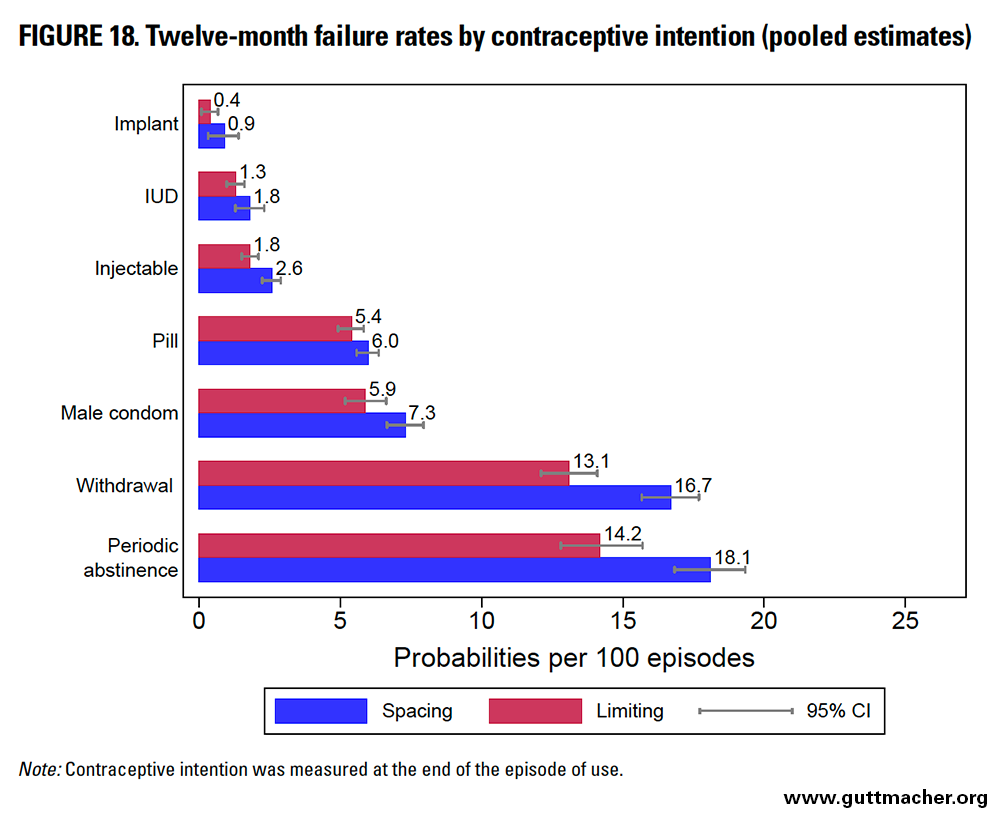
Across all methods, the 12-month contraceptive failure rates were higher (albeit by fewer than 4.0 percentage points for any individual method) among women using contraception to space, rather than limit, future childbearing (Table 9 and Figure 18), although confidence intervals overlapped substantially for implant, IUD and oral contraceptive pill users. Periodic abstinence users reported the largest absolute differential in failure rates by contraceptive intention (3.9 percentage points). Implant users reported the largest relative differential, with women using the method to space births 2.3 times more likely to experience contraceptive failure than peers using the method to limit births (although confidence intervals overlapped substantially for these two groups).
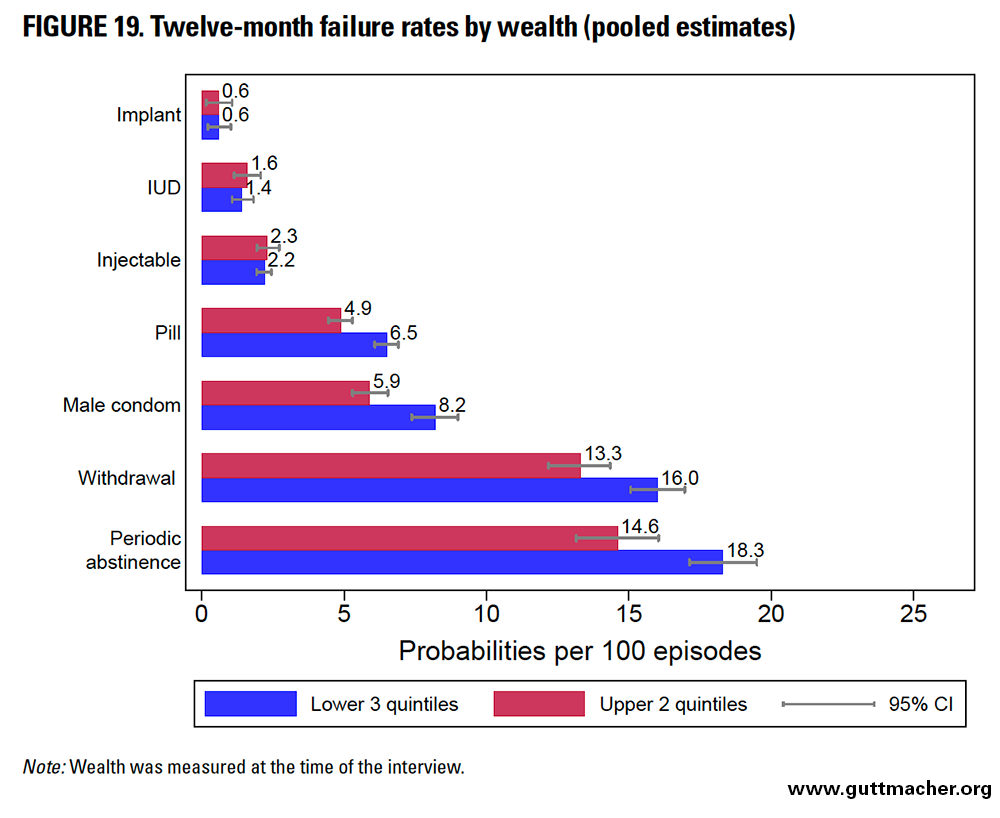
Wealth
Across most methods, 12-month contraceptive failure rates were higher for women in the lower three wealth quintiles compared with better-off peers, except among women relying on methods that depend less on the user (i.e., implants, IUDs and injectables), among whom the rates were very similar (Table 9 and Figure 19). Periodic abstinence users reported the largest absolute differential in failure rates by wealth (3.7 percentage points), while condom users reported the largest relative differential, with poorer women 1.4 times more likely to report failure as compared with wealthier counterparts. These overall patterns generally held true across subregions for most methods, except in LAC, where wealthier injectable users reported higher failure rates than poorer peers.
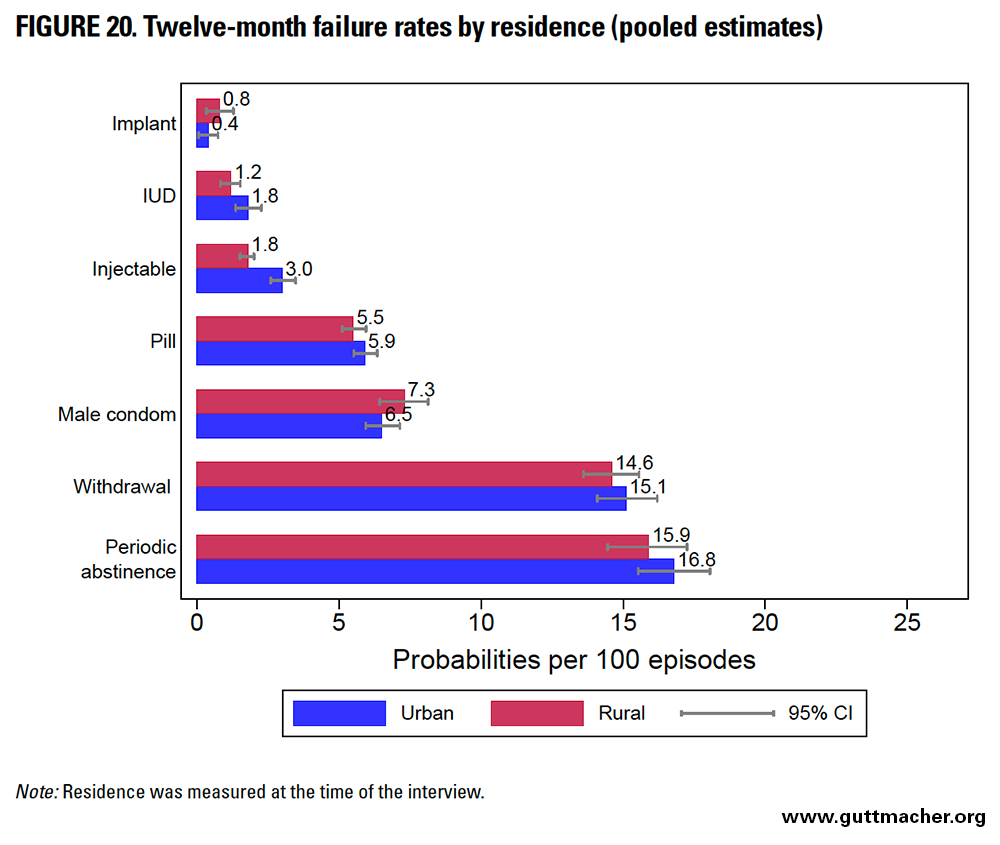
Residence
The 12-month contraceptive failure rates were fairly similar among urban and rural users, except for injectables; for this method, urban users had a higher failure rate (Table 9 and Figure 20). Injectable users reported the largest absolute differential in point estimates for failure rates by residence (1.2 percentage points). Relative differentials among IUD and injectable users by residence—with urban women using these methods 1.5 and 1.7 times, respectively, more likely to report a contraceptive failure than rural peers—were larger than the absolute differentials.
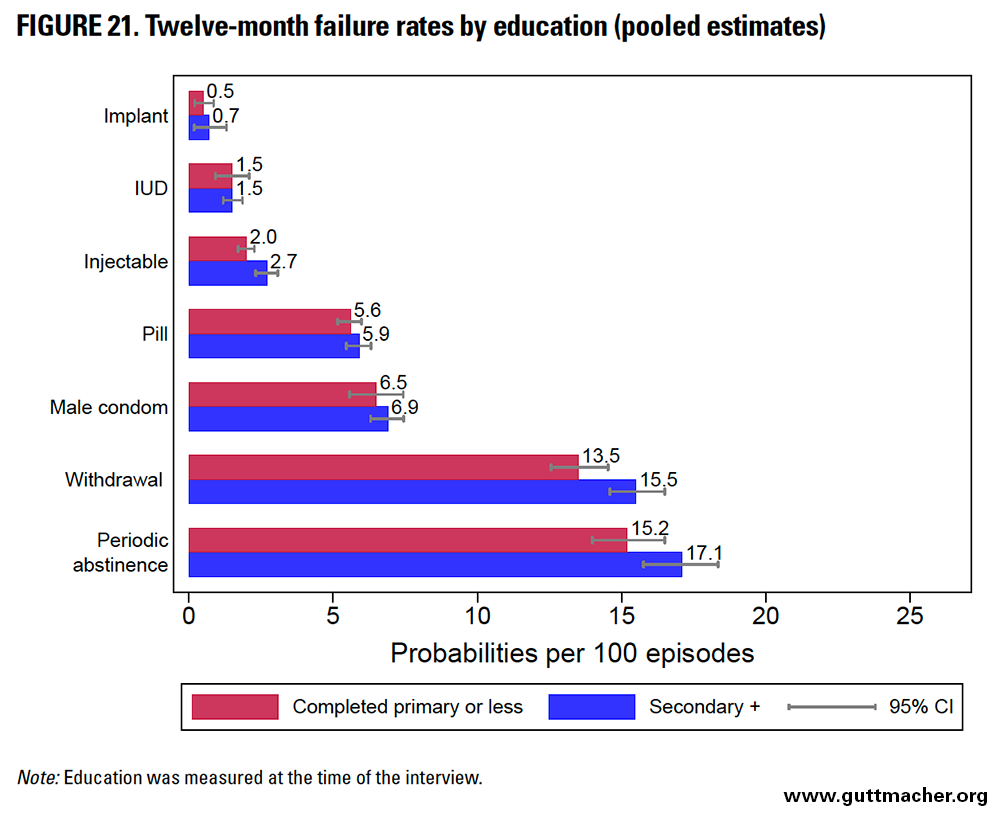
Education
When comparing results by educational level across countries, it is important to understand that a given category such as "secondary or more" may require a different number of years of schooling in different locations. In most countries, secondary or higher schooling indicates seven or more years of education, but in some, it can indicate anywhere from six to eight or even more years of schooling. We used this variable as opposed to assessing the specific number of years of education, given that the latter more often has missing data.
The 12-month contraceptive failure rates were generally similar by educational attainment for most methods, with the exception of injectables and withdrawal, for which women who had at least some secondary education had slightly higher failure rates (Table 9 and Figure 21). However, in Eastern Africa, more highly educated women had lower condom failure rates. The absolute differential in failure rates by educational status was somewhat larger among users of traditional methods such as withdrawal (2.0 percentage points) and periodic abstinence (1.9 percentage points), whereas it was quite similar across the remaining methods.
Twelve-Month Contraceptive Failure Rates by Combinations of Characteristics (Pooled Estimates)
We estimated 12 month contraceptive failure rates by various combinations of demographic and socioeconomic characteristics for a variety of reasons. For example, this approach helps to clarify whether the generally observed pattern of higher failure rates among socioeconomically disadvantaged women changes within particular demographic groups. Such analyses can determine whether the pattern of higher failure rates among younger versus older women persists across all categories of other characteristics. These analyses help to further refine the identification of specific subgroups with high failure rates who may need more attention by providers, in terms of both counseling and the quality of contraceptive services. At the same time, it is important to note that analyses assessing failure rates in two-characteristic combinations cannot control for potentially confounding effects of third characteristics.
We assessed numerous combinations of wealth, age, contraceptive intention, education, residence and parity. All combinations assessed are shown in Table 10, pooled across the 43 countries and also by subregion. Although these data may be helpful for informing policies and programs focused on improvement of contraceptive services, we comment briefly on only a handful of results, and instead provide tables to allow readers to inspect results in subregions and with combinations of interest.
Figure 22 displays median 12-month failure rates by age and wealth across 43 countries. Regardless of age, women in the lower three wealth quintiles generally had higher contraceptive failure rates than those in the upper two quintiles, except for less user-dependent methods, such as implants, IUDs and injectables, where differences are very small and occasionally in the opposite direction. Similarly, regardless of wealth, younger women generally had higher failure rates, again with the exception of the implant, where differences were small and in the opposite direction. Although both younger age and being poorer are related to the effectiveness of contraceptive use (particularly for more user-dependent methods), age may have a stronger influence than wealth: Women in the upper two quintiles of wealth who were also younger than 25 generally had slightly higher failure rates than peers in the lower three quintiles of wealth who were 25 or older.
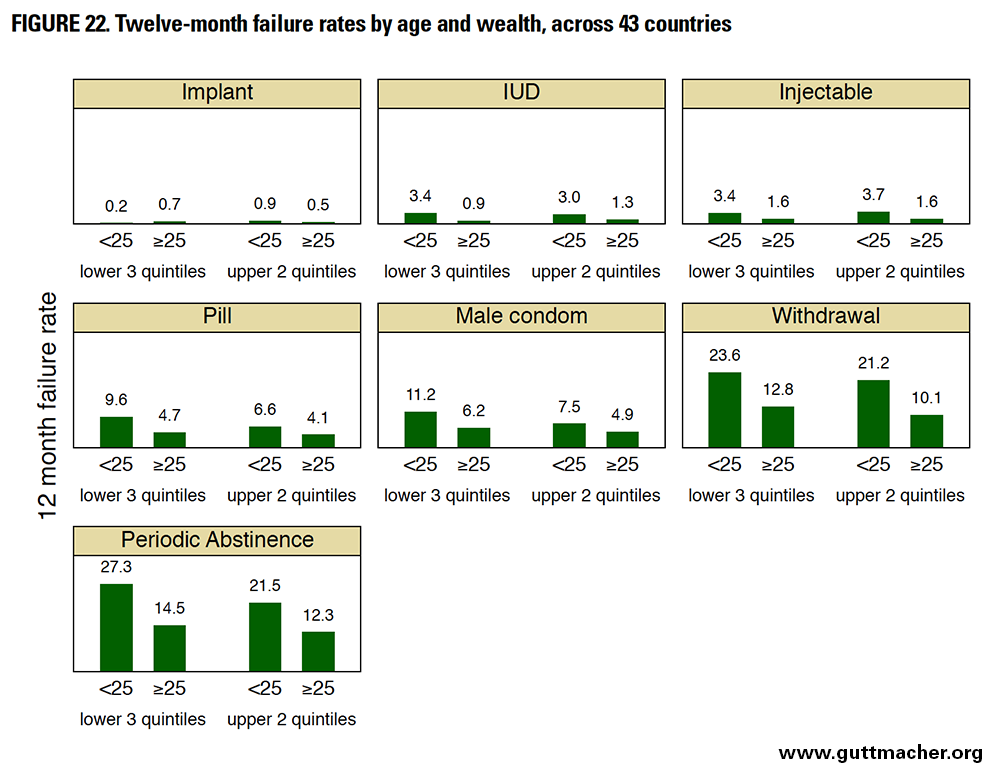
Table 11 shows 12-month failure rates by residence and age for the 43 countries combined. Regardless of whether women lived in urban or rural settings, younger users generally reported higher contraceptive failure rates than older counterparts (with the exception of implant users). However, differences between urban and rural residents were relatively small, and there was no systematic pattern, with urban women having higher failure rates for some combinations of age and method, and lower rates for other combinations. In sum, age appears to have a stronger and more systematic influence on failure rates than place of residence.
In another example (data not shown), we assessed 12-month failure rates by age and contraceptive intention. As expected, across most methods (except implants) and within each fertility intention subgroup, older women reported lower failure rates than younger peers. Within the older age-group, those using the method to space births and those using it to limit births reported generally similar failure rates (with a difference of less than 0.5 percentage points) for all methods except withdrawal and periodic abstinence. This suggests that the minor influence of contraceptive intention observed in Table 9 may be explained to a large extent by the higher likelihood of older women using methods to limit births.
In a fourth example (data not shown), we assessed 12-month failure rates by contraceptive intention and parity. Regardless of parity, contraceptive failure rates across most user-dependent methods were slightly higher for women who desired to space births instead of limit them. However, higher-parity IUD users were an exception: within this group, women using the method to limit births reported a slightly higher failure rate than those using it to space births (1.0 vs. 0.7). A similar pattern was evident for high-parity pill users, with a slightly higher rate for women using the method to limit births (5.4 vs. 4.3). Overall, however, differences in failure rates by fertility intention were modest. In general, rates among higher-parity women fell below those of lower-parity peers, particularly for users of withdrawal or periodic abstinence.
Discussion and Conclusions
Contraceptive Failure Rates Across 43 Countries
Contraceptive failure rates calculated with data from Demographic and Health Surveys (DHS) conducted in 43 countries generally reflected expected patterns. We observed low rates among users of longer-acting methods such as implants, IUDs and injectables (although with less difference between IUDs and implants as compared with injectables than previous studies have suggested27). Failure rates were higher among users of shorter-acting methods or those that are coitally dependent, such as oral contraceptive pills and male condoms. The highest failure rates were evident among users of traditional methods, such as withdrawal or periodic abstinence. Pooling data across countries allowed us to calculate contraceptive failure rates for methods that are less commonly used in most countries, such as implants. Implant users were about half as likely to report contraceptive failure as IUD users, and 23 times less likely to report contraceptive failure as users of periodic abstinence.
Our estimates for IUDs, injectables and oral contraceptive pills were similar to those of Ali et al.14 (the most recent large-scale comparative study of contraceptive failure rates): for each contraceptive method, the two sets of estimates differed by less than 0.3 percentage points (Table 12). For condoms, withdrawal and periodic abstinence, our estimates are somewhat lower than those of Ali et al., but within a difference of 2.2, 1.9 and 3.5 percentage points, respectively, despite the greater variability in rates we found for these methods (Figure 3).
Nonetheless, there are several notable differences between these two analyses. Ali et al. analyzed data from DHS surveys in 19 countries conducted between 2002 and 2009; we analyzed data from DHS surveys in 43 countries conducted largely after 2010 (but including five surveys done during the 1990s to maximize coverage of the Latin America and Caribbean [LAC] region). Representation across subregions also differed; for example, Ali et al. included just four Sub-Saharan African countries, whereas we included 15. Different representation of subregions may have implications for overall median failure rates. As one example, a greater emphasis on the correct and consistent use of condoms in subregions of higher HIV prevalence (such as Eastern Africa) may result in comparatively lower failure rates for condoms in that subregion, which could contribute to an overall lower median failure rate for this method in our analysis. Finally, unlike Ali et al., we included unmarried women in countries where possible. As failure rates differ by marital status, this difference may also have implications for overall median estimates.
Comparing our estimates with those for the United States is more complicated. Ours were somewhat higher than U.S. estimates derived from clinical data27 for implants (0.6 vs. 0.05 per 100 episodes of use) and IUDs (1.4 vs. 0.8). On the other hand, ours were markedly lower than U.S. estimates for injectables (1.7 vs. 6), oral contraceptive pills (5.5 vs. 9.0), male condoms (5.4 vs. 18.0), withdrawal (13.4 vs. 22.0) and periodic abstinence (13.9 vs. 24), which are derived from 1995 and 2002 National Surveys of Family Growth, and, importantly, corrected for abortion underreporting.
Fewer than one-half of induced abortions performed in the United States between 1997 and 2001 were reported in face-to-face interviews in the National Survey of Family Growth.24 Data obtained from a national survey of abortion clients provided information was used to correct for abortion underreporting when estimating contraceptive failure rates.13 The effect of this correction varied by method type: It had less of an impact on rates for oral contraceptive pills, injectables or withdrawal (producing less than a one–percentage point change in the failure rate, with inconsistent directionality), and a stronger impact on increasing failure rates for condoms (from 13.9 to 17.4) and fertility awareness-based methods (from 23.0 to 25.3). As noted earlier, contraceptive failure rates calculated from DHS data (including ours) are likely underestimates because of expected high levels of underreporting of abortions, which we were unable to correct for.
Contraceptive failure rates calculated using calendar data may also vary depending on the methods used. For example, although the definition of "using" is generally clear for an IUD or implant, it may be less clear for shorter-acting or coitally dependent methods, such as condoms or withdrawal. Typical-use failure rates would include periods of inconsistent contraceptive use (which may result in an unintended pregnancy), but a woman who missed an oral contraceptive pill and subsequently became pregnant, for example, may or may not have considered herself to have been using the method during the period in question. If she fails to define herself as a user during the collection of calendar data, the unintended pregnancy will not be captured in the calculation of failure rates for the oral contraceptive pill. Thus, less variability may be inherent in failure rates for longer-acting methods.
Another potential difference between various studies calculating failure rates is that the characteristics and formulation of certain methods may vary. For example, U.S. rates for implants are specific to Implanon (a one-rod implant containing etonogestrel), whereas those from DHS data may relate to other kinds of implants, such as Norplant (a six-rod implant containing levonorgestrel available until 2008), Jadelle (a two-rod implant containing levonorgestrel) or others. Similarly, domestic and international rates for injectables are likely to be primarily for the three-month injectable depot medroxyprogesterone acetate (DMPA), but in some countries, may also include uses of one-month combined (estrogen and progestin) injectables.
Contraceptive Failure Rates by Subregion
In general (and aside from estimates for Western Africa), we generally observed the lowest method-specific contraceptive failure rates in Eastern Africa and Southern Asia; this finding needs to be considered in conjunction with overall contraceptive prevalence in those subregions (low in the former and moderate in the latter) as well as with contraceptive method mix (predominantly injectables and pills in the former, and a substantial amount of female sterilization along with a mix of other methods in the latter). Where use is low, such as in Eastern Africa, users may be more highly motivated. One subregion, Northern Africa and Western Asia combined, emerges as an area in need of particular attention for prevention of unintended pregnancy: It had high contraceptive failure rates and a moderate contraceptive prevalence consisting substantially of traditional methods.
As noted in Chapter 2 the quality of calendar data may vary substantially by country and subregion. In particular, a recent comprehensive analysis suggested that failure rates based on calendar data from particular subregions (particularly Western Africa, and to a lesser extent, Eastern Africa) should be interpreted with caution because of concerns about data quality.23 Indeed, our comparisons of pooled failure rates by subregion revealed unexpectedly low values for Western Africa across most contraceptive methods. Concerns about data quality in the subregion suggest that underreporting of contraceptive method use (and method failure) is likely to result in greater underestimation of failure rates in this subregion as compared with others.
Population coverage also has implications for interpretation of results across various subregions. For example, estimates from Eastern Africa, Southern Asia and Southeastern Asia are based on surveys for countries representing more than 70% of the population in those subregions; failure rates for these subregions may be more representative than those for LAC, Northern Africa and Western Asia, and Eastern Europe and Central Asia (where population coverage of represented countries was 54%, 47% and 22%, respectively).
Contraceptive Failure Rates by Demographic and Socioeconomic Groups
Subgroup analyses suggested that contraceptive failure rates were generally higher among women younger than 25. More frequent intercourse and higher natural fertility rates in this age-group may contribute to increased contraceptive failure rates, and younger women may be particularly vulnerable to challenges in correct and consistent use of contraceptive methods, especially those that are more user-dependent. Among the demographic and socioeconomic characteristics assessed, age was associated with some of the most extreme differences in failure rates, and its influence persisted among both poorer and wealthier users.
Never-married women reported higher contraceptive failure rates than their ever-married counterparts for some methods (such as withdrawal and injectables) and lower rates for others (condoms). Having ever been married is somewhat correlated with older age, so one might expect higher contraceptive failure rates among never-married (i.e., younger) women. Condom use is more prevalent in casual partnerships and decreases in longer-term partnerships.29 When use of condoms is perceived as intended for infection prevention, married women may be less able to negotiate condom use without raising concerns about infidelity, which may result in less or less consistent use of this method.
Women with fewer children reported somewhat higher contraceptive failure rates for several methods (IUDs, injectables, pills, withdrawal and periodic abstinence); these women may have less motivation to avoid a pregnancy (because of greater desire for more children or ambivalence about having a child or another one) and are also likely to be younger. Similarly (as found in previous studies from the United States13) women who were using injectables, condoms, withdrawal and periodic abstinence to space (versus limit) pregnancies reported somewhat higher failure rates; this is not surprising, as they may have less motivation to avoid pregnancy (and again, are likely younger).
Although wealth had little impact on failure rates for longer-acting methods such as implants, IUDs or injectables, poorer women reported higher failure rates for more user-dependent methods such as pills, condoms, withdrawal or periodic abstinence. Women of lower socioeconomic status may be more challenged in terms of affordability, time or ability when it comes to obtaining a resupply of methods, and may potentially be less empowered to consistently use condoms or traditional methods.
Differentials in failure rates by factors such as urban-rural residence and by educational attainment (whether women had completed primary school or less versus secondary or more) were less striking. The similarity in failure rates by extent of schooling is consistent with findings from other studies based on DHS data.7
Implications and Conclusions
Although most unintended pregnancies occur because couples do not use contraception, contraceptive failure is also a major underlying cause, particularly where contraceptive prevalence is high and where the contraceptive method mix skews toward methods with higher failure rates. Use of a contraceptive method indicates existing motivation to prevent pregnancy, and also provides information about the availability, accessibility and acceptability of various methods for that individual. Reducing unintended pregnancy among contraceptive users is important, in addition to helping nonusers who wish to prevent unintended pregnancy to adopt a contraceptive method with which they will be satisfied.30
Availability of a wide variety of contraceptive methods is an essential first step to enable women and couples to select the most effective method that they prefer to use. This greatly increases the likelihood that they will obtain a method that they are comfortable using and that they can use correctly and consistently. Provision of clear information about the risks and benefits of all available methods is also crucial in facilitating informed contraceptive choice. Our analysis focused on the effectiveness of contraceptive methods and provides new evidence documenting that in a broad cross-section of countries, failure rates range widely by contraceptive method in expected directions. Longer-acting methods such as implants and IUDs have the lowest failure rates. Improving access to a full spectrum of contraceptive options, including such methods, may help to reduce contraceptive failure and unintended pregnancy, particularly in subregions where access to these methods is currently limited, or among groups with high failure rates for user-dependent methods (e.g., young women). Especially in areas with high HIV prevalence, counseling and services should consider the need for HIV prevention strategies in conjunction with contraceptive services. Provision of adequate information, counseling services and follow-up care may help to improve correct and consistent use, facilitate switching to preferred methods, and reduce discontinuation due to contraceptive failure for all methods. It may be particularly helpful to ensure that individuals initiating a contraceptive method are well supported to establish effective patterns of use at early stages of use, when the risk of failure is highest.
We did not assess contraceptive discontinuation for reasons other than contraceptive failure. It is important to note that discontinuation of contraceptive methods (e.g., because of health concerns or side effects) may be high, particularly for methods that can be stopped without provider assistance (unlike implants or IUDs). This type of contraceptive discontinuation may also leave women vulnerable to unintended pregnancy, so although not examined in this report, other reasons for contraceptive discontinuation are important to consider as well.
Our results help to highlight those methods, subregions and population groups that have above-average failure rates—and that are therefore in greater need of attention. For example, it may be useful to increase attention to Northern Africa and Western Asia, where failure rates are generally higher than those in other subregions, contraceptive prevalence is moderate to high, and method mix includes a substantial amount of traditional method use. Similarly, certain population groups, such as young women, appear to need particular assistance to achieve greater contraceptive effectiveness of the method they select. Increased availability and promotion of youth-friendly contraceptive counseling and services would assist young people in successfully using their chosen contraceptive method.
This analysis contributes to the existing literature in several ways. We provide a more comprehensive assessment of contraceptive failure rates across a large range of countries, according to duration of method use (12, 24 and 36 months), using largely recently collected data and including unmarried women where possible. In addition, pooling data allowed us to estimate failure rates for subregions and for population groups having different demographic and socioeconomic characteristics, including by duration of method use. This analysis also has limitations; for example, undercounting of contraceptive failures due to underreporting of abortions likely resulted in an underestimation of contraceptive failure rates. However, although the level of underreporting may vary somewhat across groups and subregions, large differences in failure rates are likely to indicate meaningful differences in failure rates between subregions and population groups. Furthermore, the advantages and disadvantages of including older surveys, as discussed in Chapter 2, also highlights the need for more recent data in particular regions, such as LAC. The limitations inherent to this study also point toward potential directions for improving data collection and analytic approaches that could enhance accurate estimation of contraceptive failure rates using DHS data. For example, it may be worth considering novel approaches to improve the quality of reproductive calendar data, developing techniques to achieve more reliable reporting of abortions (so failure rates are less affected by this factor), or assessing characteristics related to contraceptive failure using multivariate analysis.
Despite the limitations inherent when estimating contraceptive failure rates using the available data, this analysis contributes to our understanding of worldwide contraceptive failure rates and some of the factors associated with lower contraceptive effectiveness. In turn, this information can be leveraged to better assist women and couples to avoid unintended pregnancies and their negative consequences, and to have the number of children they desire when they feel ready and able to do so.
Appendix A: Calculation of Failure Rates
In the calculation of failure rates, the unit of analysis is the episode of contraceptive use. A single woman could contribute multiple episodes, if she stopped and started using contraception several times over the last five years, or no episodes if she did not use any method during that period. A woman could also contribute no episodes to the analysis if, for example, her only contraceptive use began more than five years and three months before the date of survey, or began in the three months preceding the survey. Examples of hypothetical episodes of contraceptive are shown in shown in Figure A1 and discussed below.
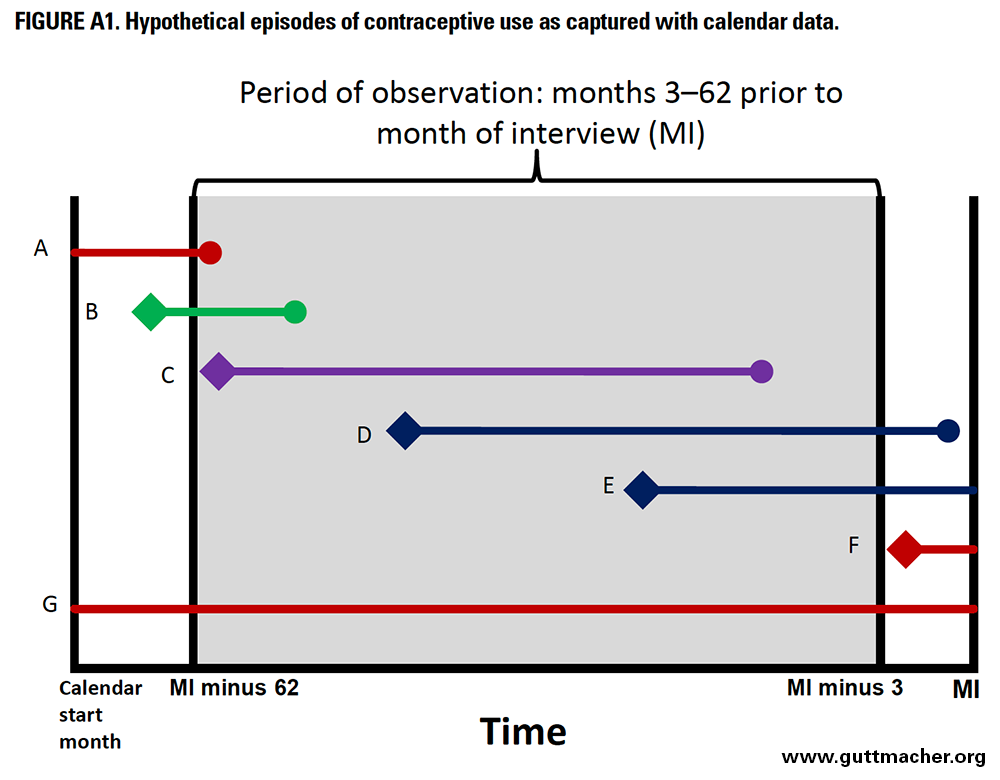
In Figure A1, the month of interview (MI) is on the far right. The gray range represents the contraceptive calendar. It generally begins in January of the calendar year five years before the interview.*§§ To standardize the calendar length for all women, we begin the observation period 62 months before the month of interview (MI minus 62). The exact length of the calendar varies for each woman, depending on the month in which she was interviewed.†* Each lettered line in the figure represents an episode of contraceptive use, with the beginning of the episode, if observed, marked with a diamond, and the end, if observed, marked with a circle.
The period of observation for calculating contraceptive failure rates is months 3–62 preceding the survey. We do not use information from the month of interview or the two preceding months because women in their first trimester may not yet recognize that they are pregnant, possibly as the result of contraceptive failure. Doing so could lead to an underestimation of failure rates because their months of contraceptive use would be included, but their contraceptive failure would not. To avoid this potential for underestimation, we exclude the calendar data for the most recent three months, and include data from only a five-year period that began 62 months before the survey, for a total of 60 months, or five years.
To calculate the duration of contraceptive use for each episode, we need to know when it began and when it ended. For episodes that began before the beginning of the calendar period—such as episodes A and G in Figure A1—we do not have information on when use began or how long the woman had been using the method at the start of our observation periods, and so must exclude the episode. While excluding these episodes from analysis may introduce bias into our failure rate estimates, we examined this possibility with sensitivity tests, assuming various durations of use for these episodes, as explained in our discussion of study limitations, and found that any biases introduced by the exclusion of these cases are likely to be small.
If an episode of use began before our observation period but within the calendar period (such as episode B), we include the episode as a late entry into the life table, using only the months of contraceptive use that occurred within the 3–62-month period of observation. For example, if episode B began two months before the period of observation (64 months before the date of interview) and ended 10 months later, the first two months of use would be excluded because they occurred outside the period of observation. The episode would enter into the life table at month 3 and contribute eight months before the woman either experienced a failure or discontinued use for another reason.
In Figure A1, episode C is completely observed within the period of observation, and thus is fully included in the life table. Episode D begins within the period of observation but continues into the three months before the interview, which is outside the period of observation. Episode E is similar, but the end of the episode is not observed, meaning that the woman was still using contraception at the time of interview. Both episodes D and E will be censored three months before the interview. Episode F begins within the three months before interview and so is excluded entirely from analysis.
Calculation of confidence intervals
In constructing the 95% confidence intervals for each cell of Tables 5, 8 and 9, we used the jackknife method. This method is a resampling technique that involves the removal of a single sampling unit, and the recalculation of the indicator from the one-less–sized sample, and doing this systematically—removing, recalculating then replacing—for each unit in the sample. This process allows for an estimate of the variance, and thus the calculation of the confidence intervals. Demographic and Health Surveys use a two-stage (or sometimes three-stage) sampling design; the first stage is the selection of primary sampling units (PSUs), which are typically enumeration areas based on a census or master sample sampling frame. The last stage in the sample selection is the selection of households, either from the PSUs in two-stage sampling or, in the case of three-stage sampling, from selected subunits or segments of the PSUs. The jackknife approach is used directly by systematically removing each individual PSU, recalculating the failure rate and estimating the variance†‡ using the sum of the squares of the differences from the full sample estimate.
Impact of inability to include left-truncated episodes of contraceptive use
Although we include right-censored episodes of contraceptive use that did not end before the date of interview, we are unable to include the left-truncated episodes that began before the calendar period started because we do not know when the episode began, and thus we do not know the duration of use. To understand how omission of these episodes might affect contraceptive failure rates, we performed sensitivity analyses by reestimating the rates including these left-truncated episodes under various scenarios: assuming all such episodes began in the month the calendar began and in three-month increments up to 36 months before the beginning of the calendar.†§ Failure rates were reestimated for 12-, 24-, and 36-month durations. We anticipated that the impact of left-truncation would be larger on failure rates of longer durations because of the way the window of observation and late entry conditions are set. In many surveys, the time between the beginning of the calendar and the beginning of the window of observation (MI minus 62 in Figure A1) is 10 or more months. In the scenario where left-truncated episodes are considered as having started in the first month of the calendar, with a 10-month gap between the beginning of the calendar and the beginning of the window of observation, left-truncated episodes of use would enter the life table at month 10. In the other scenarios the episodes enter the life table even later. In all scenarios, these episodes would therefore clearly have a minimal impact on 12-month life tables, and contribute more to the 24- and 36-month life tables.
Results of these sensitivity analyses suggested that inclusion of left-truncated episodes more often decreased failure rates than increased them, but this pattern was not consistent across all countries (Appendix Table 3). The relative difference between averaged rates of failure, comparing the standard calculation with calculations including left-truncated episodes, was greater for longer-term modern methods (IUDs and implants) and traditional methods than for shorter-term modern methods. This indicates that longer-term and traditional methods are more commonly reported as ongoing when the calendar began. It makes sense: Episodes of use that were ongoing at the time the calendar began tend to be longer durations of use, and longer-term methods tend to have longer durations of use. Overall, the exclusion of left-truncated episodes of contraceptive use seems to have a relatively small impact on failure rates. On average, including left-truncated episodes tends to decrease the contraceptive failure rates, but this is not the case for all countries. In some countries, doing so actually increases the failure rate. For example, for the 36-month pill failure rates in Turkey and Tajikistan, including left-truncated episodes increases the pill failure rate by up to 1.6 failures per 100 episodes of use. This indicates that in these countries, left-truncated episodes of use were more likely to end in failure than nontruncated episodes.
Taken as a whole, results from our sensitivity analyses generally show that the impact of excluding left-truncated episodes is minimal for 12-month failure rates, but has a slightly larger effect on 24- and 36-month failure rates. Note that the tests shown here do not address other potential biases associated with these exclusions, such as the fact that left-truncated episodes may be disproportionately more common among older women who are less fecund and thus less likely to experience failures. On the basis of the results presented here, however, we believe that any such biases are likely to have a minimal impact on the failure rates presented. On average, excluding left-truncated episodes biases failure rates slightly upward, suggesting that the results presented here may overestimate failure rates, but the impact is likely to be small.
Appendix B: Median Failure Rates Versus Pooled Failure Rates
We assessed contraceptive failure rates across the 43 included countries in two ways: by ascertaining the median failure rate by method across all countries (Table 5) and by calculating a pooled failure rate across all countries (Table 8). Table B1 displays differences in results from these two methods. The reason for the differences relates to the fact that countries with fewer than 125 episodes of use for a particular method do not contribute to the median estimate, whereas all data from all countries (including those having fewer than 125 episodes of use for a given method) are included in the pooled failure rates.
In this report, we chose to focus on median values as the overall summary measure when discussing failure rates across all 43 countries. Conversely, when discussing overall subregional failure rates, we focus on pooled rates for each subregion. Each country (including those with fewer than 125 episodes of use) contributes equal weight in pooled estimates, so we felt it more justifiable to pool countries within a subregion (given similarities between them) than to pool equally weighted countries globally, given a much greater range of differences in factors that can affect contraceptive effectiveness. Using median estimates also makes our estimates more easily comparable to those of previous analyses, such as that by Ali et al.14
References
1. Sedgh G, Singh S and Hussain R, Intended and unintended pregnancies worldwide in 2012 and recent trends, Studies in Family Planning, 2014, 45(3):301–314.
2. Singh S, Darroch JE and Ashford LS, Adding It Up: The Costs and Benefits of Investing in Sexual and Reproductive Health 2014, New York: Guttmacher Institute, 2014.
3. Brown SS and Eisenberg L, Demography of unintended pregnancy, in: Brown SS and Eisenberg L, eds., The Best Intentions: Unintended Childbearing and the Well-Being of Children and Families, Washington, DC: National Academy Press, 1995.
4. Gipson JD, Koenig MA and Hindin MJ, The effects of unintended pregnancy on infant, child, and parental health: a review of the literature, Studies in Family Planning, 2008, 39(1):18–38.
5. Tsui AO, McDonald-Mosley R and Burke AE, Family planning and the burden of unintended pregnancies, Epidemiologic Reviews, 2010, 32(1):152–174.
6. Sedgh G et al., Induced abortion: incidence and trends worldwide from 1995 to 2008, Lancet, 2012, 379(9816):625–632.
7. Curtis SL and Blanc A, Determinants of Contraceptive Failure, Switching, and Discontinuation: an Analysis of DHS Contraceptive Histories. DHS Analytical Reports No. 6., Calverton, MD, USA: Macro International Inc., 1997.
8. Moreno L and Goldman N, Contraceptive failure rates in developing countries: evidence from the Demographic and Health Surveys, International Family Planning Perspectives, 1991, 17(2):44–49.
9. Trussell J and Vaughan B, Contraceptive failure, method-related discontinuation and resumption of use: results from the 1995 National Survey of Family Growth, Family Planning Perspectives, 1999, 31(2):64–72, 93.
10. Moreau C et al., Contraceptive failure rates in France: results from a population-based survey, Human Reproduction, 2007, 22(9):2422–2427.
11. Cleland J and Ali MM, Reproductive consequences of contraceptive failure in 19 developing countries, Obstetrics & Gynecology, 2004, 104(2):314–320.
12. Trussell J, Contraceptive failure in the United States, Contraception, 2011, 83(5):397–404.
13. Kost K et al., Estimates of contraceptive failure from the 2002 National Survey of Family Growth, Contraception, 2008, 77(1):10–21.
14. Ali MM, Cleland J and Shah I, Causes and Consequences of Contraceptive Discontinuation: Evidence From 60 Demographic and Health Surveys, Geneva: World Health Organization, 2012.
15. Bradley SEK, Schwandt HM and Khan S, Levels, Trends, and Reasons for Contraceptive Discontinuation. DHS Analytical Studies No. 20., Calverton, MD, USA: ICF Macro, 2009.
16. Bradley SEK, Croft TN and Rutstein SO, The Impact of Contraceptive Failure on Unintended Births and Induced Abortions: Estimates and Strategies for Reduction. DHS Analytical Studies No. 22, Calverton, MD, USA: ICF Macro, 2011.
17. Wachter K, Essential Demographic Methods, Cambridge, MA, USA: Harvard University Press, 2014.
18. United Nations, World Population Prospects: the 2012 Revision, Geneva: United Nations Department of Economic and Social Affairs, 2014.
19. Lightbourne RE, Individual preferences and fertility behaviour, in: Cleland J and Hobcraft J, eds., Reproductive Change in Developing Countires: Insights from the World Fertility Survey, Oxford, England: Oxford University Press, 1985.
20. Bradley SEK et al., Revising Unmet Need for Family Planning. DHS Analytical Studies No. 25, Calverton, MD, USA: ICF International, 2012.
21. Goldman N et al., Contraceptive failure rates in Latin America, International Family Planning Perspectives, 1983, 9(2):50–57.
22. Moreno L, Differences by residence and education in contraceptive failure rates in developing countries, International Family Planning Perspectives, 1993, 19(2):54–60,71.
23. Bradley SEK, Winfrey W and Croft TN, Contraceptive Use and Perinatal Mortality in the DHS: An Assessment of the Quality and Consistency of Calendars and Histories. DHS Methodological Report No. 17, Calverton, MD, USA: ICF International, 2015.
24. Jones RK and Kost K, Underreporting of induced and spontaneous abortion in the United States: an analysis of the 2002 National Survey of Family Growth, Studies in Family Planning, 2007, 38(3):187–197.
25. Singh S and Henshaw SK, Measuring the incidence of abortion in countries with liberal laws, in: Singh S, Remez L and Tartaglione A, eds., Methodologies for Estimating Abortion Incidence and Abortion-Related Morbidity: A Review, New York: Guttmacher Institute, 2011.
26. Fabic MS and Choi Y, Assessing the quality of data regarding use of the lactational amenorrhea method, Studies in Family Planning, 2013, 44(2):205–221.
27. Hatcher R et al., Contraceptive Technology, 20th ed., New York, NY: Ardent Media, 2011.
28. Sivin I and Stern J, Long-acting, more effective copper T IUDs: a summary of U.S. experience, 1970-75, Studies in Family Planning, 1979, 10(10):263–281.
29. de Walque D and Kline R, Variations in condom use by type of partner in 13 sub-Saharan African countries, Studies in Family Planning, 2011, 42(1):1–10.
30. Jain A, Should eliminating unmet need for contraception continue to be a program priority?, International Family Planning Perspectives, 1999, 25(Suppl.):S39–S43,S49.
Footnotes
*Viet Nam 2002, Turkey 2003, Egypt 2008, Maldives 2009, Bangladesh 2011, Jordan 2012 and Pakistan 2012–2013.
†Bolivia, Dominican Republic, Ethiopia, Kenya, Malawi, the Philippines and Tanzania.
‡Between approximately 2004 and 2009, the DHS core questionnaire did not include information on the reasons for discontinuing use in the contraceptive calendar. Many surveys conducted during (or shortly after) this time therefore did not collect the information needed to calculate contraceptive failure rates.
§Although the sample of interviewed women is limited to those currently of reproductive age (15–49), for the youngest women, some episodes of use took place before age 15. We place these (few) episodes into the youngest age-group in analysis.
**For women who were married only once and report they are currently married at the time of survey, "ever married" is synonymous with currently married at the time of discontinuation. For formerly married women, however, we do not know the date of marital dissolution, and for women who were married more than once, we do not know the date of any marriage after the first. We therefore can classify women only as "ever-married" or "never-married" at the time of the episode of contraceptive use. We note that, although Ali et al.14 say they analyze only episodes of use that occurred within marriage, it is not possible to measure marital status at the time of the episode for all women (except in a few surveys that also included a month-by-month history of marriage within the calendar).
††It is impossible for parity or contraceptive intention to change between the start and end of an episode of use, because births cannot occur during one continuous use episode. Age and marital status, however, could change during one episode of use. Although this means that the characteristics are measured at different times for different episodes of use, we thought it preferable to classify failures by women's age and marital status when the failure occurred, rather than by age and marital status at the start of the episode up to three years prior. In practice, very few episodes of use would change categories if the classification were based on the beginning of the episode, because likely very few women transitioned from never-married to ever-married or from younger than age 25 to age 25 or older during one use episode.
‡‡This includes nonnumeric responses to the question on ideal number of children, such as "up to God." We reason that women who do not give a numeric ideal family size, but still use contraception, are using it in order to space, rather than limit, their births.
§§DHS surveys do not collect direct information on income or wealth, but do collect information on household ownership of durable goods and amenities that have been shown to be correlated with household wealth status. (For more information, see: Rutstein SO and Johnson K, The DHS Wealth Index. DHS Comparative Reports No. 6, Calverton, MD, USA: ORC Macro, 2004.) For each DHS survey, a "wealth index" made up of these survey items is constructed using principal components analysis, placing households on a continuous scale of wealth, which is then divided into equally sized quintiles.
*†This is a more conservative approach than that of Ali et al.14, which used a cutoff of 100 episodes.
*‡Because the DHS asks detailed questions about sexual activity and contraception, decision makers in seven countries (Viet Nam 2002, Turkey 2003, Egypt 2008, Maldives 2009, Bangladesh 2011, Jordan 2012 and Pakistan 2012–2013) felt it was inappropriate to include never-married women. In these countries, we cannot estimate sexual activity outside of marriage and essentially assume that it occurs only within marriage. For these countries, the columns with denominators of "sexually active women" are therefore limited to those who are married or in union (hereafter referred to as married). In Morocco, unmarried women were interviewed but not asked about sexual activity. This survey sample is therefore treated like ever-married samples, and "sexually active" refers to married women only. In seven other countries (India 2005–2006, Azerbaijan 2006, Armenia 2010, Cambodia 2010, Nepal 2011, Indonesia 2012 and Tajikistan 2012), fewer than 1.5% of unmarried women reported being sexually active. In all other countries, unmarried women are considered to be sexually active if they report they had sex in the three months preceding the interview.
*§Please note that in Figures 7 through 13, the x-axes are not consistent across methods.
***Unless a country did not contribute any episodes of use for a given method; unweighted numbers of contraceptive episodes are provided in the Online Appendix Tables (See "Additional Downloads" list above).
*††Age, marital status and parity at the end of a contraceptive use episode; contraceptive intention at the start of each episode of use; and wealth quintile, residence and education at the time of the interview.
*‡‡As previously noted, never-married women were not included in surveys in seven countries, which may affect results and lead to less stable estimates among this group.
*§§Most contraceptive calendars begin in the January five years (or six years, depending on the survey) before the date of interview in countries with Gregorian calendars. Countries such as Ethiopia and Nepal use local calendars, which begin in the first month of their year. A small number of other countries have calendars that start in different months; for example, the Columbia 2010 survey used November 2004 as a start point, and earlier surveys in Bangladesh (although not the 2011 survey) used April or June as the start point.
†*For example, in the Indonesia 2012 survey, the calendar began in January of 2006, and interviews were conducted in May through August of 2012. For women interviewed in May, the calendar contains 65 months of data, and for women interviewed in August, it contains 68 months of data.
†‡The variance is calculated as where n is the total number of PSUs, is the failure rate calculated from the full sample, and is the failure rate from the sample excluding PSU i. Using this approach, the confidence intervals were calculated as:
†§Specifically, failure rates were reestimated assuming the left-truncated episodes began 0, 3, 6 and 9 months before the beginning of the calendar for the 12-month rates; 0, 3, 6, 9, 12, 15, 18 and 21 months before the 24-month rates; and 0, 3, 6, 9, 12, 15, 18, 21, 24, 27, 30 and 33 months before the beginning of the calendar for the 36-month rates. Appendix Table 3 shows the minimum and maximum values from these calculations, and compares these values with the failure rates calculated using the standard of dropping left-truncated episodes, which is equivalent to the left-truncated episodes entering the 12-, 24- and 36-month life tables at 12, 24 or 36 months, respectively.
Acknowledgments
This report was written by Chelsea B. Polis (Guttmacher Institute), Sarah E.K. Bradley (University of California, Berkeley), Akinrinola Bankole (Guttmacher Institute), Tsuyoshi Onda (Guttmacher Institute), Trevor Croft (ICF International) and Susheela Singh (Guttmacher Institute).
The authors would like to thank the following Guttmacher colleagues: Jacqueline E. Darroch and Kathryn Kost for providing comments on an earlier version of the report; Kathleen Randall for supervising production; and Alyssa Browne for research assistance. We also thank Glen Heller, independent consultant, for providing data tabulations, and Susan London, independent consultant, for editing the report.
The authors are also grateful to the following external reviewers who provided helpful comments on an earlier version of the report: James Trussell, Princeton University; Sian Curtis, University of North Carolina, Chapel Hill; John Cleland, London School of Hygiene & Tropical Medicine; Tom Pullum, ICF International; and Michelle Weinberger, Avenir Health.
This report was funded by UK aid from the UK Government. The views expressed are those of the authors and do not necessarily reflect the UK Government’s official policies. The Guttmacher Institute also gratefully acknowledges the generous unrestricted support it receives from individuals and foundations—including major grants from The William and Flora Hewlett Foundation and the David and Lucile Packard Foundation—which undergirds all of the Institute’s work. The findings and conclusions of this report are those of the authors and do not necessarily reflect positions or policies of the donors.
© Guttmacher Institute, 2016
Suggested citation: Polis CB et al., Contraceptive Failure Rates in the Developing World: An Analysis of Demographic and Health Survey Data in 43 Countries, New York: Guttmacher Institute, 2016, [https://www.guttmacher.org/report/contraceptive-failure-rates-in-developing-world].
Supporting Resources
This report is accompanied by a news release.