This fact sheet highlights key data points related to abortion in the United States, drawing largely on the Guttmacher Institute’s long-standing efforts to document abortion numbers and rates, characteristics of people having abortions and related indicators.
The US abortion policy landscape continues to evolve in the wake of the US Supreme Court’s June 2022 decision in Dobbs v. Jackson Women’s Health Organization that overturned Roe v. Wade. The latest information on abortion policies in effect in each state—including total abortion bans and other restrictions—can be found on Guttmacher’s interactive abortion policy map.
Numbers and Rates
- An estimated 1,037,000 abortions were provided by clinicians in states without total bans in 2023, an increase of 11% from 2020, when the total was 930,160.1 These counts do not include self-managed abortions, such as those obtained using abortion pills mailed from pharmacies outside the United States. Evidence suggests self-managed abortions have increased since Dobbs.2
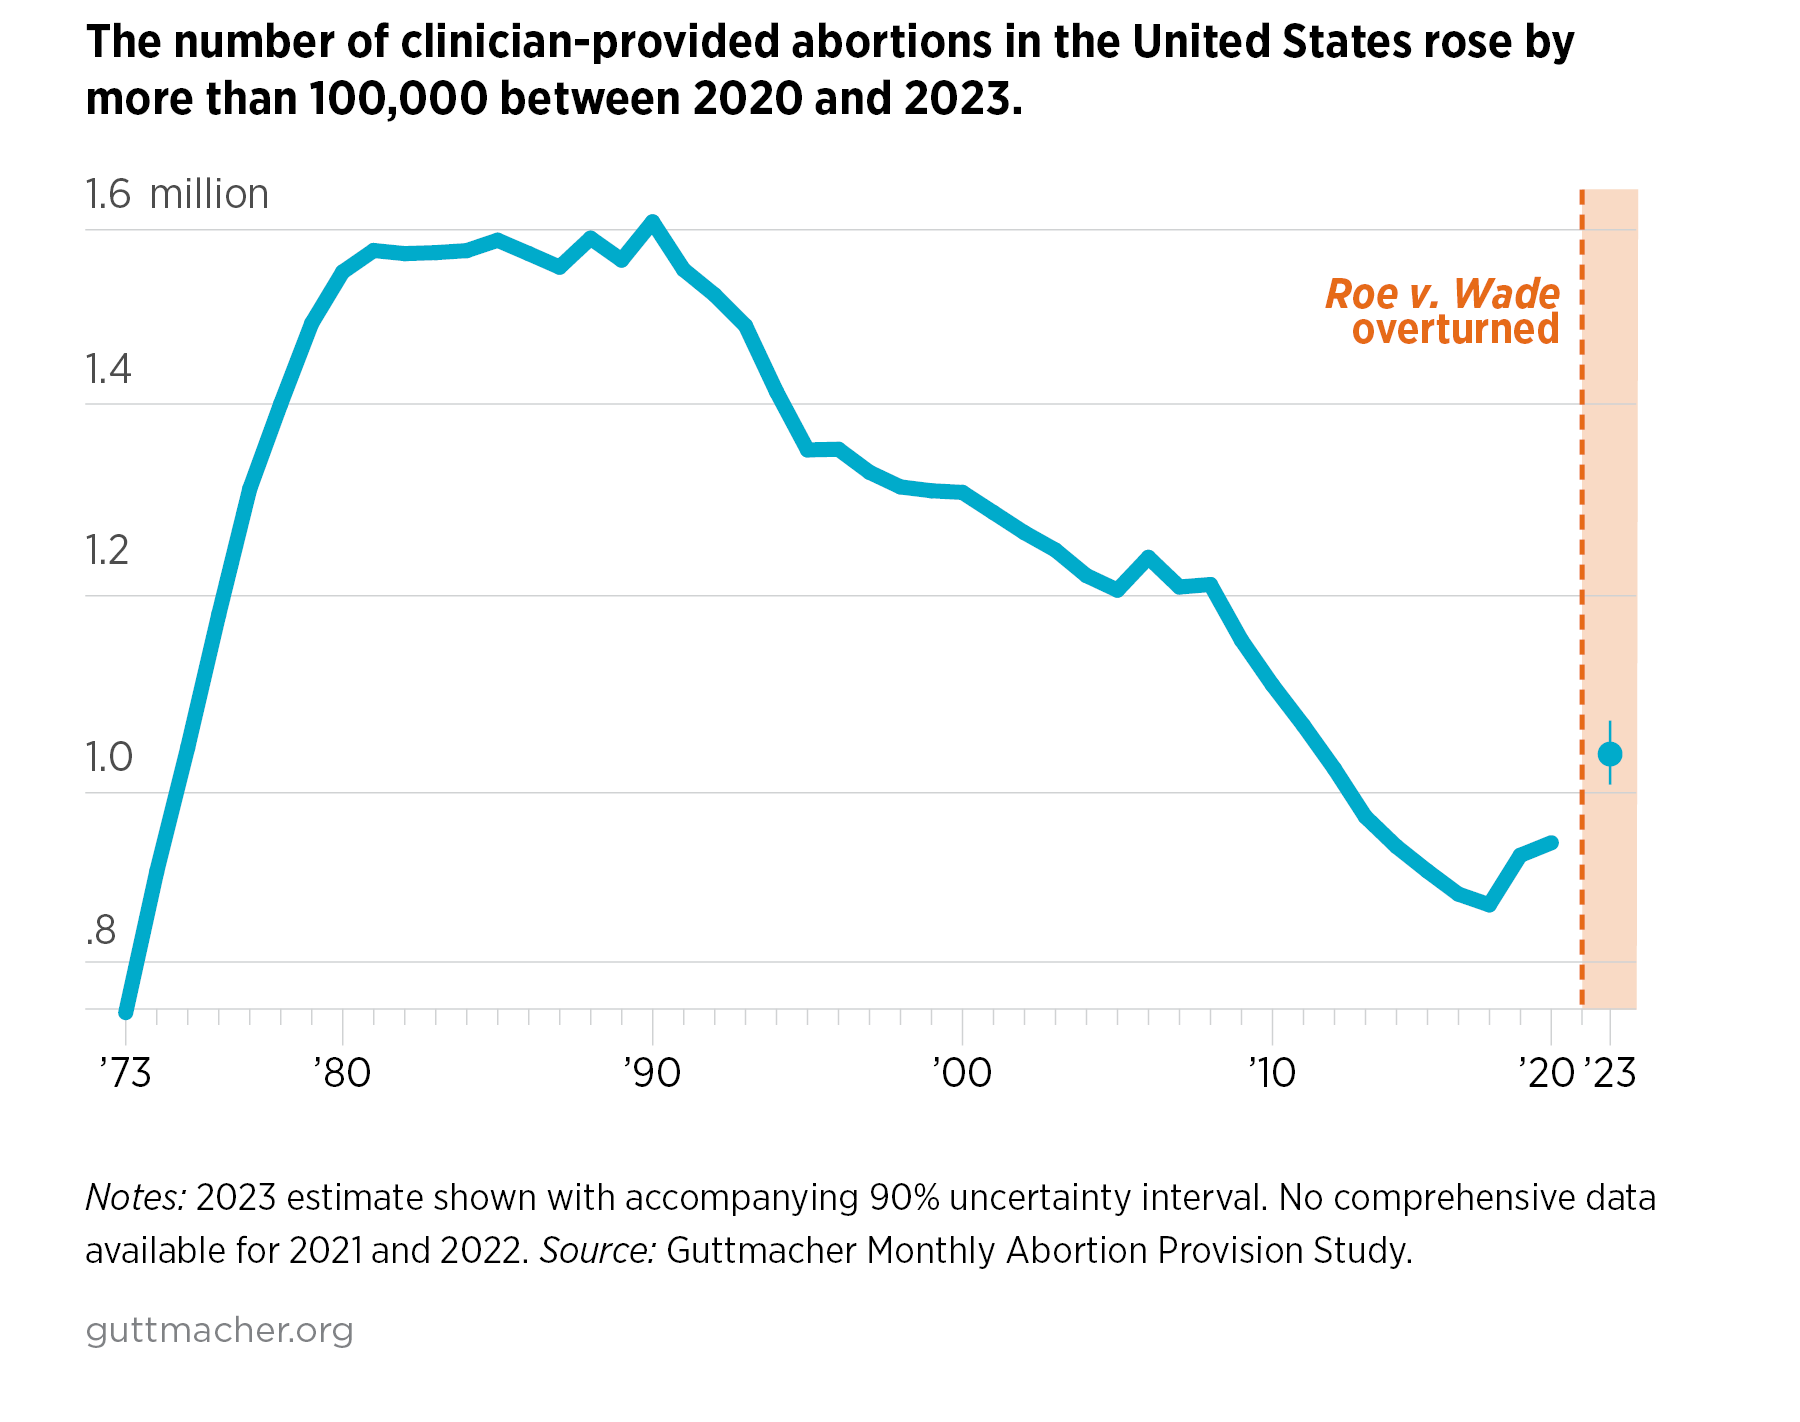
- The abortion rate in 2023 was 15.9 abortions per 1,000 women aged 15–44, up 11% from 2020.1
- Current national and state abortion counts are available from the Guttmacher Monthly Abortion Provision Study. US abortion incidence data for 1973–2020 are available from the Guttmacher Data Center.
Providers
- In 2023, 765 brick-and-mortar clinics were providing abortion services in the United States, a 5% decline from 807 in 2020.3
- As of March 2024, there were no clinics providing abortion care in the 14 states with total abortion bans in effect at that time. These states had 63 clinics in 2020.3
- In the remaining 36 states and the District of Columbia, where abortion was not completely banned, there were 21 more brick-and-mortar clinics operating in March 2024 than in 2020, a 3% increase.3
- Online-only, or virtual, clinics also provide abortion care. The number of virtual clinics in the United States changes frequently, and precise counts are not available.4
Out-of-State Travel
Abortion bans and other restrictions imposed or enforced after Roe was overturned have led to a surge in people traveling from states where abortion is banned or heavily restricted to seek care in states where abortion is available.5
- More than 166,000 US abortion patients traveled to other states to obtain care in 2023. Half as many (81,000) did so in 2020.6
- The share of all abortion patients who traveled out of state for care increased from 9% in 2020 to 17% in 2023.6
Medication Abortion
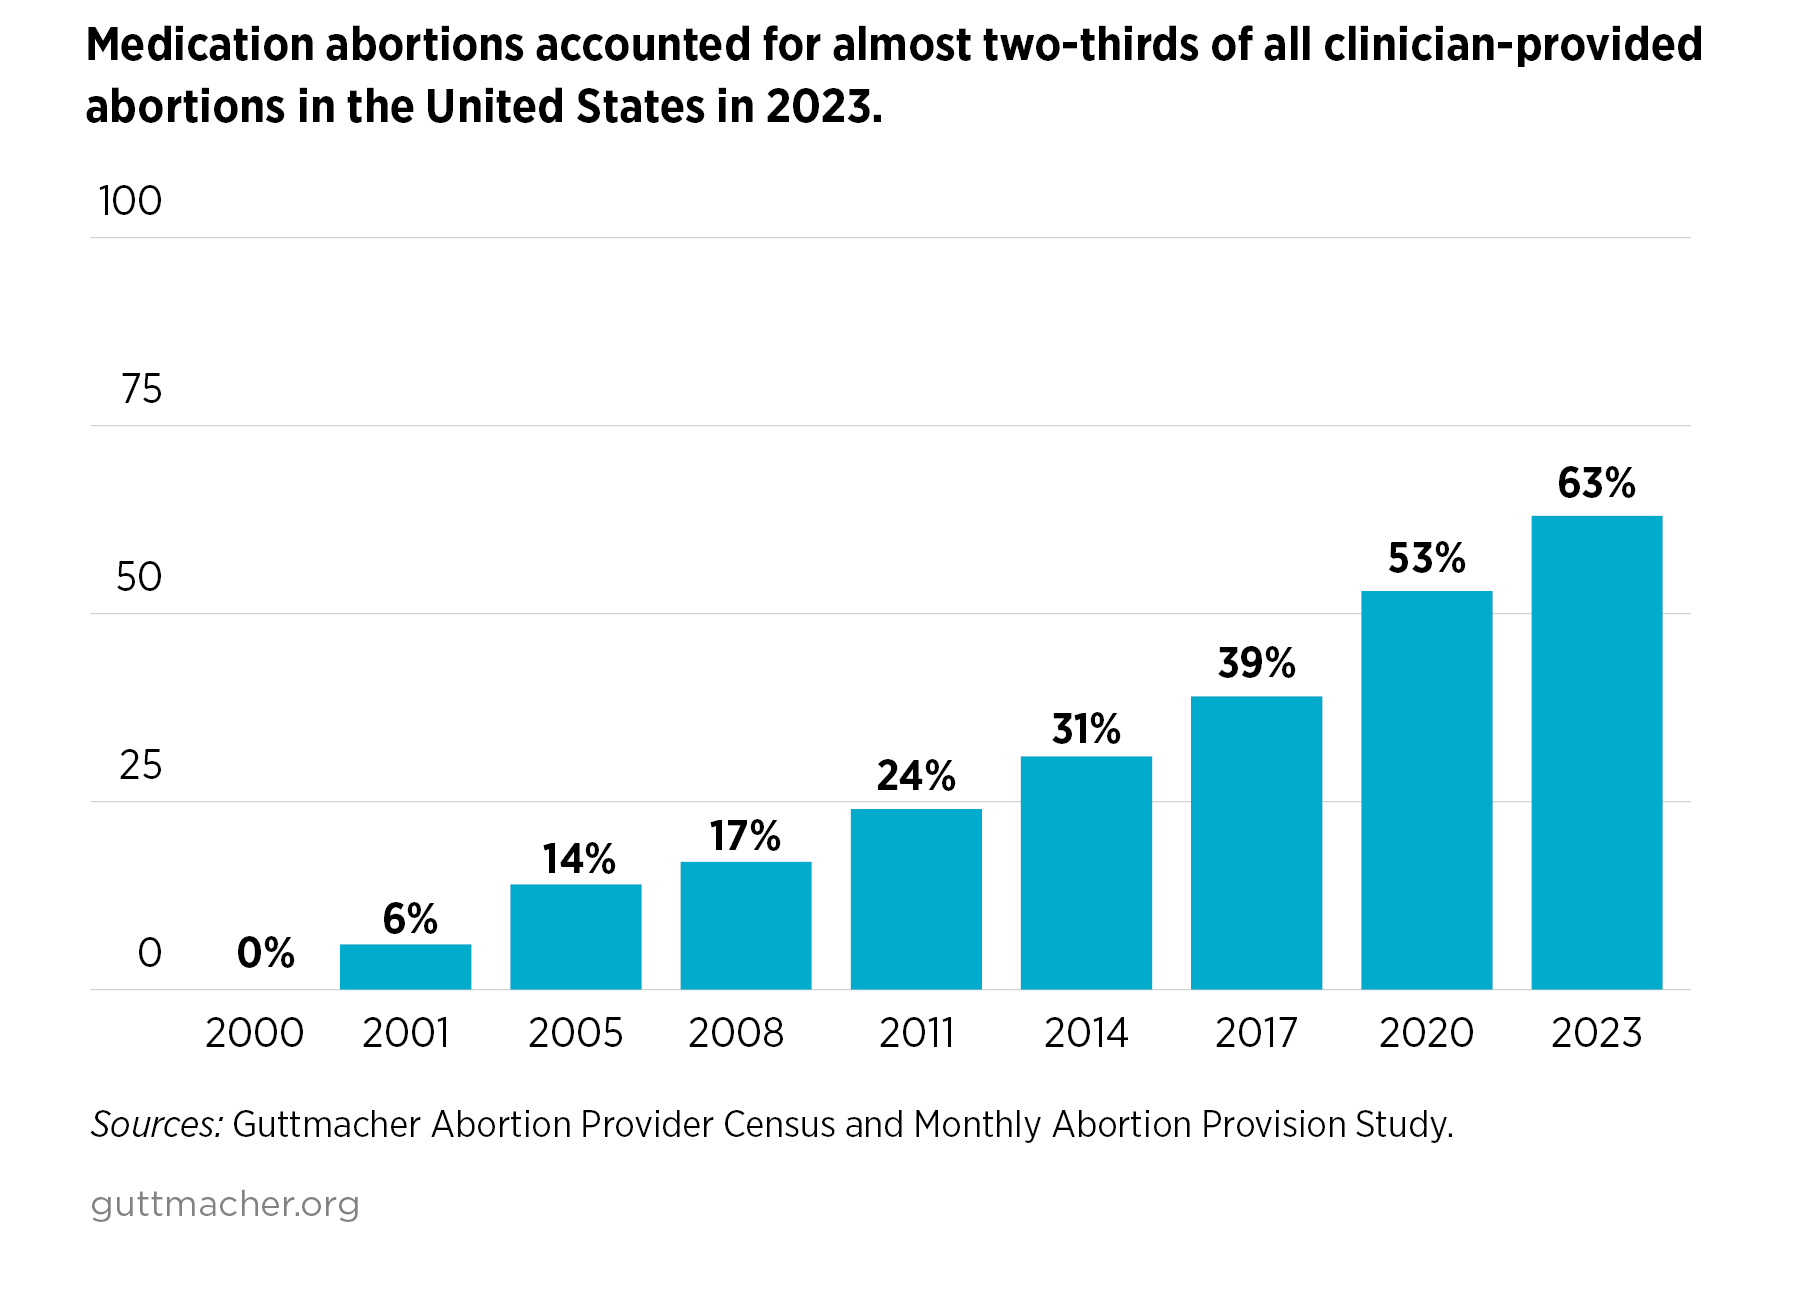
Medication abortion accounted for 63% of all clinician-provided abortions in states without total bans in 2023; by contrast, this method accounted for 53% of abortions in 2020.7 This estimate does not include self-managed abortions or any abortions occurring in states with total bans.
Characteristics of People Obtaining Abortions
The most recent data on the characteristics of people having clinician-provided abortions in the United States were collected in June 2021–July 2022 and represent the population of people obtaining abortions in the year prior to the Dobbs decision. The profile of people obtaining abortions may have changed since then.
- Among people obtaining an abortion, more than half were in their 20s: 33% were aged 20–24 and 28% were 25–29.8
- Adolescents made up 10% of people obtaining an abortion; 2% of people obtaining an abortion were 17 or younger.8
- Similar proportions of people obtaining an abortion were Black (29%), Latinx (30%) or non-Hispanic White (30%). Four percent were Asian and 7% identified as another race or ethnicity or as more than one race.8
- Some 55% of people who obtained an abortion had previously had at least one birth.8
- Sixteen percent of people having abortions identified as nonheterosexual: 12% identified as bisexual, 2% as pansexual, 0.3% as lesbian and 2% as something else.9
- Some 41% of people obtaining abortions had an income below the federal poverty level (FPL) and 30% had incomes between 100% and 199% of the FPL.8
- Approximately one in four women are expected to have an abortion by age 45, given 2020 abortion rates.10
- According to data from the Centers for Disease Control and Prevention, in 2021: 45% of abortions were obtained at six weeks’ gestation or earlier, 49% at 7–13 weeks’ gestation, and 7% at 14 weeks’ gestation or later.11

Insurance Coverage and Payment
Most individuals who obtained abortion care had health insurance in 2021–2022. Insurance does not necessarily cover abortion services, and even when it does, patients may not use available coverage.
- More than three-quarters (78%) of people getting clinician-provided abortion care had health insurance: 45% had Medicaid coverage, 27% had private insurance and 6% were insured through the Affordable Care Act’s exchanges. Twenty-two percent did not have health insurance.8
- More than half (53%) of people paid out of pocket for their abortion in 2021–2022.8
- Medicaid was the second most common method of payment and was used by 30% of people obtaining abortions. Thirteen percent of people used private insurance to pay for abortion care, and 15% relied on financial assistance (such as donations from abortion funds) to pay for some or all of the cost of their care.8