Women between the ages of 13 and 44 who are sexually active and able to become pregnant, but do not wish to become pregnant, are in need of contraceptive services and supplies. Those women who are poor or low-income and those who are teenagers may need subsidized contraceptive care through the Title X family planning program and through other sources of public funding. This report and summary tables present data on the number of women in need of contraceptive services in the United States at the national and state levels. The data also include estimates of the numbers of women served and the impact that publicly funded family planning services have on reducing rates of unintended pregnancy. This report does not provide data on unmet need for contraception.
Contraceptive Needs and Services, 2014 Update

Reproductive rights are under attack. Will you help us fight back with facts?
Key Points
- In 2014, 20.2 million U.S. women were in need of publicly funded contraceptive services and supplies. That is, they were aged 13–44, sexually active and able to conceive, but were not intentionally pregnant nor trying to get pregnant, and were either adults with an income under 250% of the federal poverty level or were younger than 20. (This number does not represent unmet need for contraception, because many of these women were using contraceptives.)
- Between 2010 and 2014, the overall number of women in need of publicly funded contraceptive services rose 5%, and particularly large increases were seen among poor women and Hispanic women. Notably, the number of teens in need declined.
- Between 2013 and 2014—as major components of the Affordable Care Act (ACA) were implemented—the number of women in need of publicly funded contraceptive services who had no public or private health insurance fell 19%, from 5.6 million to 4.5 million. States that had implemented the ACA’s Medicaid expansion experienced particularly large declines.
- Between 2010 and 2014, the overall number of women receiving contraceptive services from publicly funded providers—either publicly funded clinics or private doctors serving Medicaid enrollees—decreased by 13%, from 8.9 million to 7.8 million; the number served by clinics dropped by 22%, while the number served by private doctors increased by 14%.
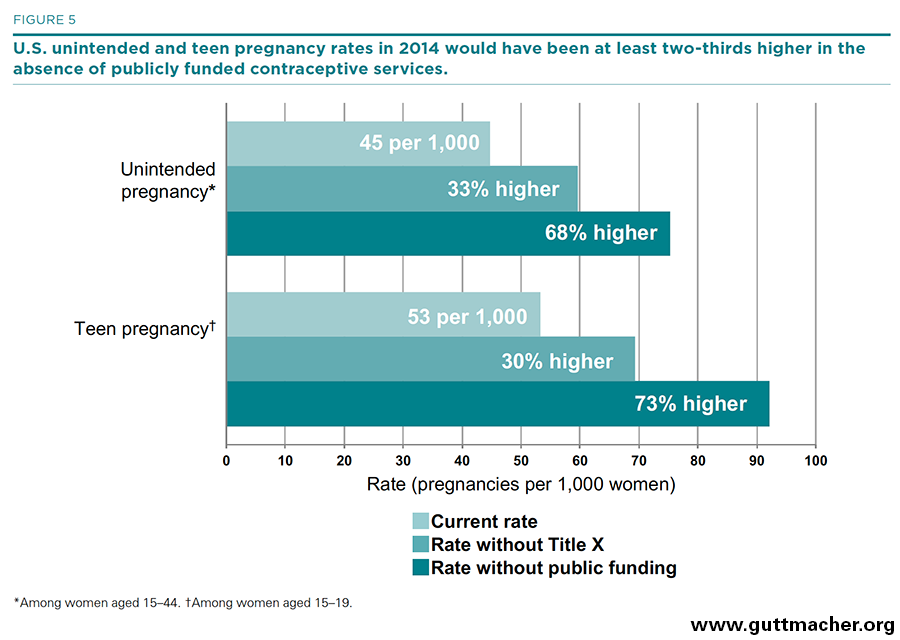
- In 2014, publicly funded contraceptive services helped women prevent 1.9 million unintended pregnancies. Without these services, the U.S. rates of unintended pregnancy, unplanned birth and abortion each would have been 68% higher, and the teen pregnancy rate would have been 73% higher.
- Title X–funded clinics alone helped women avert 904,000 unintended pregnancies, 439,000 unplanned births and 326,000 abortions in 2014. Without the services provided by these clinics, the U.S. rates of unintended pregnancy, unplanned birth and abortion each would have been 33% higher, and the teen pregnancy rate would have been 30% higher.
Background
Most U.S. women at some point in their lives need contraceptive care so that they can plan the size and timing of their families; many need ongoing or periodic access to such care. The availability of a wide range of contraceptive methods helps to ensure that women and their partners can find one that works best for their personal situation and current stage in life. Many women, however, cannot afford to pay for contraceptives and related services on their own; others may be concerned with confidentiality when seeking care. These women are among many who depend on publicly funded providers for access to the care they need and want.
A nationwide network of publicly supported clinics, including those that are funded through the federal Title X family planning program—the only national program dedicated to providing subsidized contraceptive services to individuals who are disadvantaged because of their age or income—has long been the key source of contraceptive care for teens and low-income adults. Each year, this network serves millions of women and helps to prevent more than a million unintended pregnancies and hundreds of thousands of unplanned births and abortions. In addition to the network of safety-net clinics, private doctors* serving clients enrolled in Medicaid provide an alternative source of contraceptive care for low-income women. Understanding how many women need this care and the numbers of women currently served by publicly supported providers is crucial for the planning and design of improved health care delivery systems. Moreover, in a time of unprecedented change in health care financing and increased access to health insurance coverage, it is even more important to have regular assessments of the level of need for publicly funded care, information on the numbers of women in need who have either public or private health care coverage, and continued monitoring of the role and impact of safety-net providers.
Since the 1970s, the Guttmacher Institute has periodically estimated the number of U.S. women who are in need of contraceptive services and supplies† during a calendar year (those aged 13–44 who are sexually active and able to conceive, but who are not intentionally pregnant nor trying to get pregnant) and in need of publicly funded contraceptive services and supplies (those who meet all of the above criteria and are either adults with an income under 250% of the federal poverty level or teenagers of any income).
Estimates of need for contraceptive services have often been published together with data on the number of women who receive publicly funded contraceptive care and the impact that providing publicly supported contraceptive care has on helping women to prevent unintended pregnancies and the unplanned births and abortions that would follow. Most recently, estimates for these indicators were made at the national, state and county levels for 20101 and at the national and state levels for 2013.2
This report provides updated 2014 estimates of contraceptive needs and services in the United States, and of the impact that publicly funded clinic services in particular have on preventing unintended pregnancy at the national and state levels. It also provides estimates of the level and impact of Medicaid-funded contraceptive care provided by private doctors at the national level. It does not provide updated information on the cost savings from any of these services; the most current information on cost savings is from 2010.3
This report highlights national-level findings and trends, and includes summary tables of national and state data. Detailed county-level information on numbers and characteristics of women in need has not been estimated for 2014, with one exception: Information on the number and proportion of women in need who are uninsured has been estimated for all U.S. counties and can be found in Guttmacher’s county-level table maker at https://data.guttmacher.org/counties.
Methodology
The following methodology was used to update for 2014 these key national and state-level contraceptive needs and services indicators:
- The number of women in need of contraceptive services and supplies and those in need of publicly supported contraceptive care, including the number and proportion who are uninsured
- The number of women who received contraceptive services at all publicly funded family planning providers, including publicly funded clinics and private doctors who served Medicaid enrollees
- The numbers of pregnancies, births and abortions averted by providing publicly funded contraceptive care
Key Definitions
We used the following definitions in our analyses.
- Women are defined as being in need of contraceptive services and supplies if they are aged 13–44 and meet the following three criteria during all or part of a given year:
- (1) they were sexually active (estimated as those who have ever had voluntary vaginal intercourse);
- (2) they were able to conceive (neither they nor their partner had been contraceptively sterilized, and they did not believe that they were infecund for any other reason); and
- (3) they were neither intentionally pregnant nor trying to become pregnant.
- Women are defined as in need of publicly funded contraceptive services and supplies if they meet the above criteria and have a family income below 250% of the federal poverty level. In addition, all women younger than 20 who need contraceptive services, regardless of their family income, are assumed to need publicly funded care because of their heightened need—for reasons of confidentiality—to obtain care without depending on their family’s resources or private insurance.
- Publicly funded contraceptive services and supplies are provided through two main channels. A publicly funded clinic is a site that offers contraceptive services to the general public and uses public funds to provide free or reduced-fee services to at least some clients. These sites may be operated by a diverse range of provider agencies, including public health departments, Planned Parenthood affiliates, hospitals, federally qualified health centers (FQHCs) and other independent organizations. In this report, these sites are referred to as "clinics;" other Guttmacher Institute reports may use the synonymous term "centers." In addition, some private providers offer Medicaid-funded services.
- A female contraceptive client is a woman who made at least one initial or subsequent visit for contraceptive services during the 12-month reporting period. This includes all women who received a medical examination related to the provision of a contraceptive method and all active contraceptive clients who made supply-related return visits, who received counseling and a method prescription but deferred the medical examination or who chose nonmedical contraceptive methods, even if a medical examination was not performed, as long as a chart was maintained. All female contraceptive clients who received care from publicly funded clinics are counted; this includes a small proportion of clients who paid for their visit using private insurance or who paid the full fee for services because their income was above the threshold for free or reduced-fee services.
- Poor women are those whose family income is under 100% of the federal poverty level ($19,790 for a family of three in 2014).
- Low-income women are those whose family income is between 100% and 250% of the federal poverty level ($19,790–49,475 for a family of three in 2014).
Women in Need of Contraceptive Services and Supplies
To update estimates of the numbers of women in need of contraceptive services and supplies, we began with state-level 2014 U.S. Census Bureau estimates of the numbers of women by age-group (younger than 20, 20–29 and 30–44), and race and ethnicity (non-Hispanic white, non-Hispanic black, Hispanic and other).4 We further divided these groups according to marital status and poverty status using the 2014 American Community Survey (ACS). We did so by estimating the proportion of women in each age-group, by race and ethnicity, according to their marital status (married and living with husband or not married) and their income as a percentage of the federal poverty level (less than 100%, 100–137%, 138–199%, 200–249% and more than 250%).5 Proportions of women in the ACS in each age, race and ethnicity, marital status and poverty group were calculated for each state and then applied to the Census Bureau estimates of the numbers of women (by age-group, and race and ethnicity) in that state. For further explanation of this methodology, see the Contraceptive Needs and Services, 2010 Methodological Appendix.6
The final step for updating estimates of women in need of contraceptive services and supplies for 2014 was to apply the proportion of women in each demographic subgroup (by age, race and ethnicity, marital status and poverty status) who were in need of contraceptive services and supplies (because they were sexually active, able to conceive and not pregnant nor trying to become pregnant) to the numbers of women in that subgroup. For this report, we use the same tabulations of the 2006–2010 National Survey of Family Growth (NSFG) that were made for our 2010 report.1
Women in Need of Contraceptive Services and Supplies Who Are Uninsured
We estimated the proportion of women in need of publicly funded contraceptive services and supplies who are uninsured by first estimating the proportion of all women who are uninsured, according to age and poverty status. We used the Census Bureau’s Small Area Health Insurance Estimates (SAHIE)7 program to generate proportions of women who were uninsured at the state and county level. The age categories available through SAHIE did not exactly match the age-groups for women in need. For adult women (aged 20–44) in need, we used estimates of insurance status for women aged 18–49 available from SAHIE. These were further divided, by poverty status, into two groups: 0–137% of the federal poverty level and 138–249% of the federal poverty level. For adolescents (aged 13–19) in need, there was no comparable SAHIE age-group. At the state level, we estimated the proportion of all women aged 13–19 who were uninsured using the 2014 ACS (the data on which SAHIE estimates are based). We compared this with the SAHIE estimate for females aged 17 and younger; in all states, the SAHIE estimate for the proportion of females 17 and younger who were uninsured was much lower than the ACS estimate for females aged 13–19, because young children are typically insured at higher rates than adolescents. We created a state-level adjustment factor as the quotient of the ACS and SAHIE results and used this to adjust the SAHIE county-level estimates for females 17 and younger to estimate the proportion adolescents in need who were uninsured. For both adults and adolescents, we assumed that the proportion of all women of any given age and poverty group who were uninsured was equivalent to the proportion of women in need (of the same age and poverty group) who were uninsured.
Women Served at Publicly Funded Family Planning Clinics
We estimated the total numbers of women and teens receiving contraceptive care at publicly funded family planning clinics in 2014 from two sources. For the number of clients using Title X–funded family planning clinics, we used 2014 Title X program data, tabulated by state, excluding male clients and all clients served in U.S. territories.8 These clinics accounted for 71% of all female family planning clinic clients. We estimated the remaining 29% of women served at publicly funded clinics—those using clinics that do not receive Title X funds—by starting with published state tabulations of data for all clinics for 2010,1 the most recent year available, and adjusting them forward in time according to the observed state-level change in clients between 2010 and 2014 experienced by Title X clinics (which we assumed was the same as the change in non–Title X clinics). To separate out the share of women who were teens, we used the overall proportion of teens served at Title X clinics in 2014 to adjust the proportion of teens served at all clinics, by state, from 2010 and applied those adjusted ratios separately to our 2014 counts of all women served and women served at Title X clinics by state.
Women Receiving Medicaid-Funded Contraceptive Services from Private Providers
To estimate the number of women receiving Medicaid-funded contraceptive services from private doctors, we used information on payment and source of care for contraceptive services reported by respondents to the 2011–2013 NSFG.9 Among the 25.1 million women who reported receiving at least one contraceptive service in the prior 12 months, 75% (18.9 million women) reported receiving that care from a private doctor; of those, 13.3% (2.5 million women) reported that their contraceptive visit had been paid for by Medicaid. It is possible that this is an underestimate of publicly funded services provided by private doctors, because it does not account for the changes in Medicaid eligibility for women living in states that expanded Medicaid coverage in 2014 under the Affordable Care Act. Updated NSFG data for 2014 that accounts for this change will not be released until late 2016 and will be included in the 2015 estimates.
Proportion of Need Met by Publicly Supported Providers
We estimated the proportion of need met as the ratio of the number of clients receiving publicly supported contraceptive services to the number of women of reproductive age who are in need of publicly supported services. This estimate does not account for the fact that some women who receive care from clinics may not fit the definition of being in need. In addition, it cannot be used to derive a measure of unmet need because some women who are in need but are not served by clinics may have private health insurance or may obtain services from nonclinic sources that they pay for out of pocket. National percentages of met need include all women receiving contraceptive care from publicly supported clinics, as well as Medicaid clients who received such care from private doctors. State estimates are for need that is met by clinics only and exclude women who receive Medicaid-covered services from private providers, because accurate data on the numbers of Medicaid clients receiving contraceptive care from private providers are not available at the state level. All estimates are for women receiving contraceptive services from a medical provider and exclude users of nonprescription methods who did not visit a contraceptive service provider during the year.
Impact of Publicly Supported Contraceptive Care
We estimated the numbers of unintended pregnancies, unplanned births and abortions that were averted by the provision of publicly funded contraceptive care at clinics in 2014 using the same methodology as in previous estimates.1,6 To do so, we began with the total number of female contraceptive clients and teen clients served. We adjusted these numbers based on the fact that some clients served do not obtain or use a contraceptive method. In 2014, 84% of women served at Title X clinics reported current use of a contraceptive method.8 We assumed that this same percentage applied to all clinics and estimated the total number of method users in that year to be 84% of all clients served, including 84% of teen clients. Next, we estimated the total number of unintended pregnancies prevented in 2014 for all women, and for teens separately, by multiplying the number of method users—nationally and in each state—by the ratio of pregnancies prevented per user. This ratio was most recently estimated to be 288 unintended pregnancies averted per 1,000 method users.6 Finally, we classified the unintended pregnancies averted according to observed outcomes at the national level. Overall, 49% of unintended pregnancies result in an unplanned birth,10 36% in an elective abortion and 15% in miscarriage; for teens, those figures are 51%,11 32% and 17%, respectively. To estimate the increase in rates of unintended and teen pregnancy that would be expected in the absence of publicly funded contraceptive services, we compared the most recent national counts of unintended pregnancy11 and teen pregnancy12 with our estimates of unintended pregnancies averted in 2014.
Table Notes
- The source for all 2014 data in the tables and figures is this report. Data for earlier years (women in need for 2010, 2006 and 2000, and for clients served for 2010, 2006 and 2001) have most recently been reported on in our 2010 report.1
- All population and client estimates have been rounded to the nearest 10; numbers of unintended pregnancies, births and abortions averted have been rounded to the nearest 100. State and subgroup totals, therefore, do not always sum to the national total.
- Racial and ethnic subgroup totals do not sum to the overall total because the subgroup of women reporting other or multiple races is not shown separately, although it is included in the overall total. The numbers of women in need who are Asian and Pacific Islander are too small to be estimated accurately.
The Need for Publicly Funded Contraceptive Services
Women are estimated to be in need of contraceptive services and supplies if they are aged 13–44 and during all or some of the year they are sexually active and able to conceive, but are not intentionally pregnant nor trying to get pregnant. Women are in need of publicly funded contraceptive services and supplies if they meet all of these criteria and are either adults with an income under 250% of the federal poverty level or teenagers of any income (see Key Definitions). These estimates represent the number of women who may need to seek contraceptive services during the year in order to prevent an unintended pregnancy. They do not represent unmet need for contraception because many of these women are using contraceptives: Some are obtaining publicly funded care from either clinics or private doctors, as detailed in the next section; others are obtaining privately funded care from private doctors or are using over-the-counter methods.
Overall Need for Services
In 2014, there were 67.5 million U.S. women of reproductive age (13–44), a number that has remained relatively stable since 2000—increasing only 1% between 2000 and 2010, and another 2% between 2010 and 2014 (Tables 1 and 2). However, the size of some key subgroups has changed considerably between 2010 and 2014:
- The number of women aged 20–29 rose 5%, while there were only small shifts among those aged 30 and older (2% increase) and among teenagers (3% decrease).
- The number of poor adult women (those aged 20–44 with a family income below 100% of the federal poverty level) rose by 12%.
- The number of Hispanic women rose by 8%.
More than half of all women of reproductive age (38.3 million) were in need of contraceptive services and supplies in 2014. This number represents a 10% increase between 2000 and 2010, plus an additional 2% increase between 2010 and 2014.
- The largest increases in the need for contraceptive services and supplies between 2010 and 2014 were among poor and low-income women (11% and 7%, respectively) and Hispanic women (8%), reflecting trends observed among all women of reproductive age.
- There was a small increase among non-Hispanic black women (4%) and a small decrease among non-Hispanic white women (1%).
Table 2 includes state-level detail on the numbers of women of reproductive age and women needing contraceptive services and supplies in 2014, by key characteristics.
Need for Publicly Funded Services
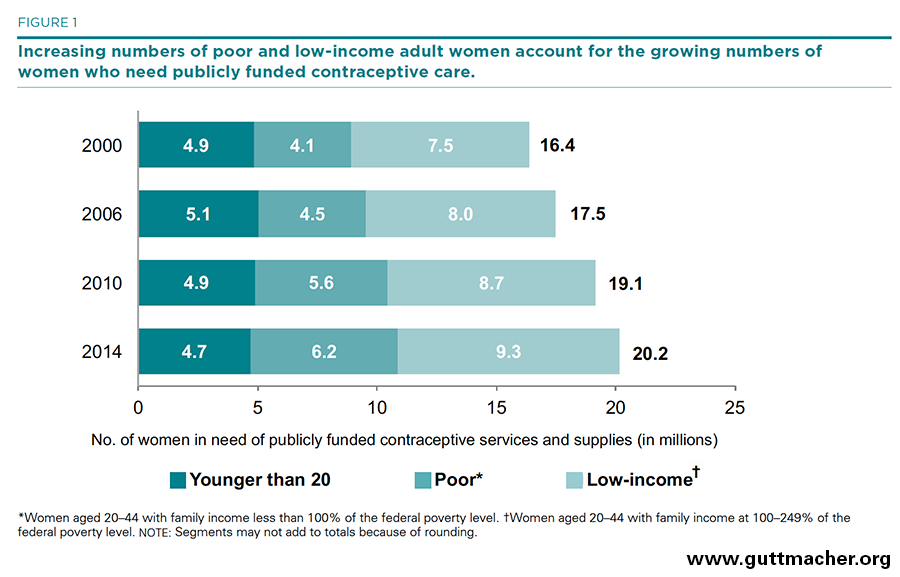
A total of 20.2 million U.S. women were classified as being in need of publicly funded contraceptive services and supplies in 2014 because they needed contraceptive services and supplies and were either adult women with a family income under 250% of the federal poverty level or were younger than 20 (Tables 1 and 3).
- Some 15.5 million women in need of publicly funded contraceptive services and supplies were adults living below 250% of the federal poverty level; 6.2 million were poor and 9.3 million were low income.
- Young women aged 13–19 accounted for 4.7 million of the women in need of publicly funded contraceptive services.
- Of all women in need of such services and supplies, 9.8 million were non-Hispanic white, 3.6 million were non-Hispanic black and 5.0 million were Hispanic. The remaining 1.8 million women were members of other or multiple racial and ethnic groups.
Overall need for publicly funded contraceptive care increased dramatically over the past decade and a half, rising from 16.4 million women in 2000 to 20.2 million women in 2014. The extent of the increase has varied across social and demographic groups, largely mirroring demographic changes among all women (Tables 1, 3 and 4 and Figure 1). The share of all women in need of publicly funded services who were poor adult women rose the most—from 25% (4.1 million out of 16.4 million) in 2000 to 31% (6.2 million out of 20.2 million) in 2014.
- Between 2010 and 2014, the number of women in need of publicly funded care rose by 5%—representing an additional one million women in need.
- Need rose the most among those with the lowest family incomes—11% among poor women, and 7% among low-income women.
- Over this same period, the number of Hispanic women in need of publicly supported care increased by 9%, the number of black women in need increased by 6% and the number of white women in need increased by 2%.
- The number of teenagers in need of publicly funded services fell by 4% over the period.
State variation in need. States varied widely in terms of their changing patterns of need for publicly supported family planning care, with virtually all states experiencing either an increase in the numbers of women in need or no significant change in need between 2010 and 2014 (Table 4).
- Sixteen states (Alaska, Arizona, California, Florida, Georgia, Hawaii, Maryland, Montana, Nebraska, Nevada, New Jersey, North Carolina, Oregon, Rhode Island, Washington and Wyoming) experienced a 7% or greater increase in the number of women needing publicly funded contraceptive services or supplies between 2010 and 2014. Four of these states (Alaska, Montana, Nevada and New Jersey) experienced a 10% or greater increase.
- Only one state (Delaware) experienced a decline (of only 1%) in the number of women in need of publicly funded care during this period.
Numbers of uninsured women in need. Implementation of the ACA has provided many Americans with access to health insurance that was previously out of reach—including both public insurance through the federal-state Medicaid program and private insurance purchased through the ACA’s health insurance marketplaces (which may be federally subsidized for low-income individuals). As a result, the numbers of women in need of publicly funded contraceptive care who were uninsured fell dramatically between 2010 and 2014, with most of the change happening between 2013 and 2014 (Table 5).
- Between 2013 and 2014, the number of all women in need of publicly funded contraceptive care who had neither public nor private health insurance fell by more than one million, from 5.6 million to 4.5 million, a decline of 19%. The proportion of women in need who were uninsured declined from 28% in 2013 to 23% in 2014.
- Among teenagers in need, most of the change in insurance status occurred earlier than for adult women, with the proportion uninsured falling from 15% in 2010 to 11% in 2013, and then to 10% in 2014. The drop in the proportion uninsured, combined with the overall drop in the number of teenagers in need described earlier, resulted in an overall decline in the number of uninsured teenagers in need, from 746,700 in 2010 to 438,200 in 2014—a 41% decline.
- Among women in need of publicly funded contraceptive care with incomes below 138% of poverty (the income eligibility ceiling for Medicaid in states that expanded the program under the ACA), 39% (3.1 million women) were uninsured in 2010. This proportion fell to 36% (3.2 million women) in 2013 and then to 30% (2.5 million women) in 2014, representing an overall 18% drop since 2010 in the numbers uninsured.
- Among non-Hispanic white and non-Hispanic black women in need, the proportion who were uninsured fell from 22% and 23%, respectively, in 2013 to 17% in 2014 for both, a 21% decline in numbers uninsured. The proportion of Hispanic women in need who were uninsured fell from 40% to 35% over the same period, a 15% drop in the number who were uninsured.
State variation in insurance status of women in need. States varied widely in terms of the proportion of women in need of publicly funded contraceptive services and supplies who were uninsured, and in the level of change experienced between 2013 and 2014 in the proportions uninsured (Table 6). In addition, between 2013 and 2014, there was generally a much larger drop in the proportions of uninsured women in need in states that expanded Medicaid under the ACA compared to states that did not. Additional county-level detail on the proportion and number of uninsured women in need is available at https://data.guttmacher.org/counties.
- In five states (Alaska, Florida, Georgia, Oklahoma and Texas) at least 30% of all women in need were uninsured in 2014; the state with the highest proportion uninsured was Texas, where 37% of all women in need had neither public nor private health insurance. These same states were among those with the highest proportions uninsured in 2013, and none of them had expanded Medicaid under the ACA by the end of 2014.
- In contrast, in three states (Hawaii, Massachusetts and Vermont) and the District of Columbia, the proportion of women in need who were uninsured in 2014 was 10% or lower, and all of these states expanded Medicaid under the ACA.
- Moreover, among the states that had expanded Medicaid, the number of women in need who were uninsured fell by at least 13% and by as much as 47% between 2013 and 2014 (for example, in West Virginia, the proportion of women in need who were uninsured fell from 28% to 15%, and the number uninsured dropped from 31,500 to 16,800, a 47% decline). Among all states that expanded Medicaid combined, the number of uninsured women in need fell 26% between 2013 and 2014.
- In contrast, among the states that did not expand Medicaid, the number of women in need who were uninsured fell by only 3% in one state and by 6–19% in all the remaining states. Among all states that did not expand Medicaid combined, the number of uninsured women in need fell only 12% between 2013 and 2014.
Use of Publicly Funded Contraceptive Services
Across the United States, publicly supported contraceptive care is provided by thousands of clinics that receive public funding through a variety of federal, state and local sources. These clinics include health departments, hospital outpatient clinics, federally qualified health centers (FQHCs), Planned Parenthood clinics and facilities run by other organizations. In addition, many private doctors provide publicly funded contraceptive care to Medicaid enrollees.
Women Served by Publicly Funded Providers
In 2014, an estimated 7.8 million women received publicly supported contraceptive services from all sources (Table 7 and Figure 2). The majority—an estimated 5.3 million female contraceptive clients—were served at publicly funded clinics; an estimated 2.5 million women received Medicaid-funded contraceptive care from private providers. Among women served at clinics, 71% (3.7 million‡) were served at Title X–funded clinics (Table 8), and 29% (1.5 million) were served at public clinics not funded by Title X.
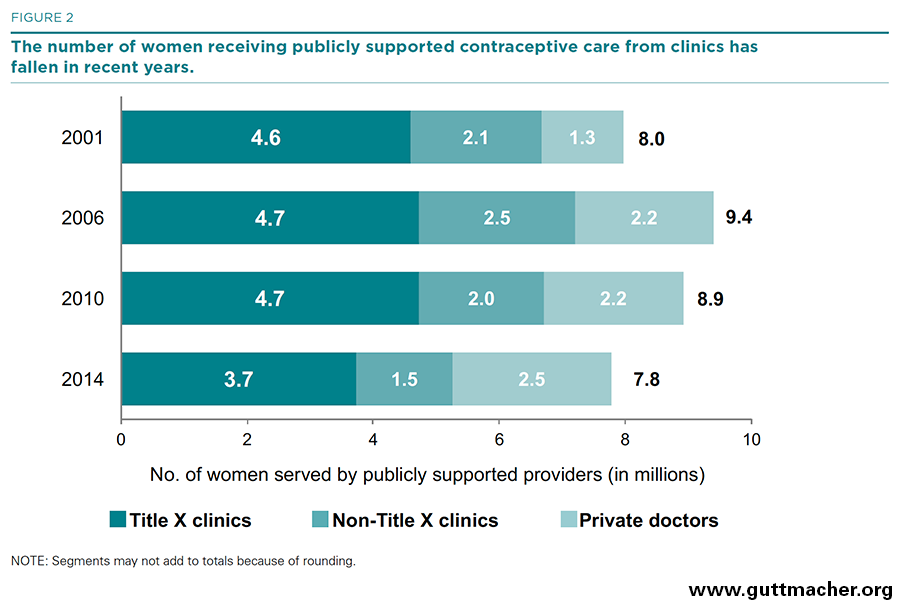
- Between 2010 and 2014, the number of women receiving publicly funded contraceptive services from all publicly supported providers fell from 8.9 million to 7.8 million, a 13% decline; the number of these women who were served by clinics fell from 6.7 to 5.3 million (a 22% decline), while the number of Medicaid enrollees receiving contraceptive care from private doctors rose from 2.2 million to 2.5 million (a 14% increase).
- The majority of states (45) experienced a drop in the number of female contraceptive clients served at publicly funded clinics between 2010 and 2014; five states (Alaska, Rhode Island, Tennessee, Vermont and West Virginia) and the District of Columbia experienced an increase.
- Similar patterns in the numbers of women served and trends over time were found at Title X–funded clinics.
Proportion of Need Met by Publicly Funded Providers
Publicly funded providers met roughly 39% of the need in 2014 for publicly supported contraceptive services and supplies (Table 9). Nearly eight million of the 20 million women in need of care were served by publicly funded providers; 19% of the need was met by Title X–funded clinics, 8% was met by public clinics not funded by Title X and 12% by private providers serving Medicaid enrollees (Figure 3). (The remaining women did not necessarily have an unmet need, because some of them may have obtained contraceptives without public funds from private doctors or over the counter.)
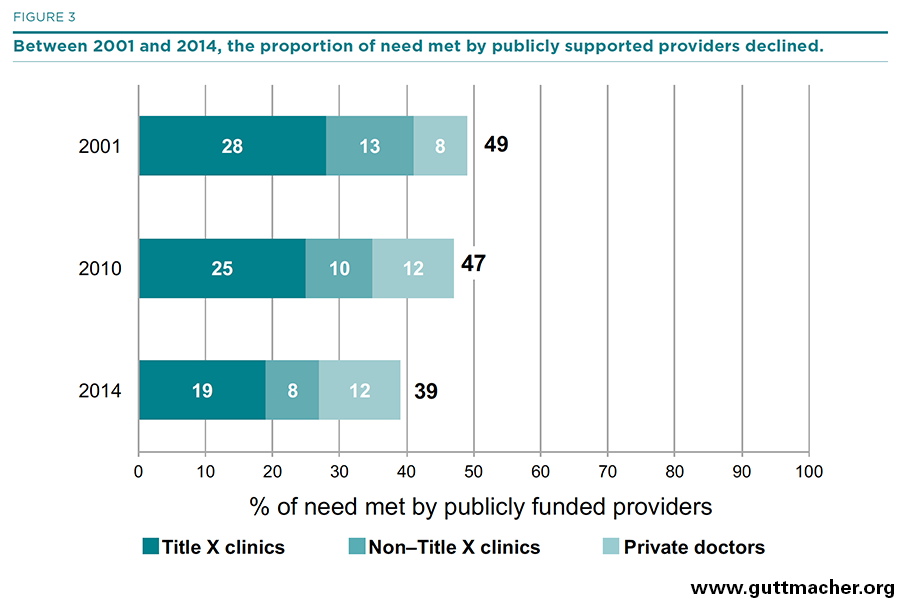
- Between 2001 and 2014, the overall proportion of need met by all publicly funded providers fell by 10 percentage points, from 49% to 39%, largely because of the rising numbers of women needing publicly supported care and the fact that the number of women cared for by publicly funded providers did not keep pace with the increasing need.
- The proportion of need met by public clinics displayed an even steeper decline, falling from 41% in 2001 to 35% in 2010 and 26% in 2014 (15 percentage points overall), primarily because of the drop in the number of women served.
- Title X–funded clinics met 19% of the need for publicly supported contraceptive care in 2014—lower than in 2001 (28%) and 2010 (25%).
- The proportion of the need for publicly funded contraceptive services met by all clinics varied widely by state. In 2014, clinics met at least half of the need for such care in three states (Alaska, California and Vermont) and the District of Columbia, whereas publicly funded clinics in 20 states (Arizona, Florida, Georgia, Idaho, Illinois, Indiana, Kansas, Kentucky, Louisiana, Michigan, Missouri, Nebraska, Nevada, New Jersey, North Carolina, Ohio, Texas, Utah, Virginia, and Wisconsin) met less than 25% of the need for such care.
The Impact of Publicly Funded Contraceptive Services
By allowing women access to the contraceptive services they need and want, providers of publicly funded contraceptive services are able to help women achieve their childbearing goals. A host of benefits accrue when women and families are able to plan the timing and number of their children.13,14 One of the most basic benefits of these services is the prevention of unintended pregnancy.
Unintended Pregnancies Averted
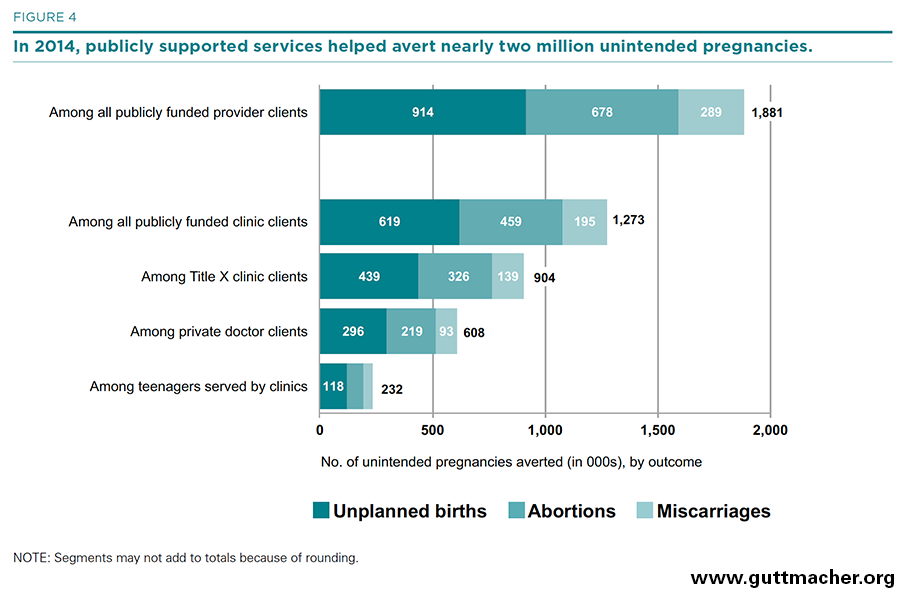
- Publicly funded providers as a whole helped women to avert 1.9 million unintended pregnancies in 2014 (Table 10 and Figure 4). More than 914,000 of those unintended pregnancies would have resulted in unplanned births and 678,000 would have resulted in abortion; the remainder would have resulted in miscarriage.
- Publicly funded clinics alone were responsible for helping women to avert some 1.3 million unintended pregnancies in 2014, which would have resulted in 619,000 unplanned births and 459,000 abortions.
- Title X–funded clinics accounted for the large majority of this benefit, helping women to avert 904,000 unintended pregnancies in 2014, which would have resulted in 439,000 unplanned births and 326,000 abortions.
- An estimated 960,000 adolescents (aged 19 or younger) were served at publicly funded clinics in 2014 (Table 11). That year, 20% of adolescents in need of publicly funded contraceptive services and supplies were served at clinics. Clinics helped adolescents avert 232,000 unintended pregnancies in 2014; Title X–funded clinics helped adolescents prevent 166,000 of these unintended pregnancies.
- Without the contraceptive services provided by all publicly funded providers in 2014 (including both clinics and private doctors serving Medicaid enrollees), the rates of unintended pregnancies, unplanned births and abortions in the United States would have been 68% higher, and the rate of teen pregnancy would have been 73% higher (Figure 5).
- Without the contraceptive services provided by publicly funded clinics in 2014, the rates of unintended pregnancies, unplanned births and abortions would have been 46% higher, and the rate of teen pregnancy would have been 41% higher (not shown).
- Title X–funded clinics alone were responsible for half of the overall impact: Without their services, the rates of unintended pregnancies, unplanned births and abortions would have been 33% higher and the rate of teen pregnancy would have been 30% higher (Figure 5).
Discussion
Since 2000, the number of U.S. women in need of publicly funded contraceptive services and supplies has continued to rise—increasing 17% between 2000 and 2010, and by another 5% from 2010 to 2014. In the four years between 2010 and 2014 alone, more than one million additional women needed publicly funded contraceptive care.
A large share of the increase in need for publicly funded care was because of a disproportionate rise in the number of poor adult women (those with a family income below 100% of the federal poverty level): The number of women in this group in need of contraceptive services and supplies rose by 37% between 2000 and 2010, and by another 11% between 2010 and 2014. The increased number of women in need—especially in the lowest income groups—is attributable in large part to growing income disparities in the United States during the period, which were exacerbated by the recession and its economic consequences.15 Moreover, since the number of poor women in need increased more than the numbers of low-income women in need, while the number of teens in need fell, the share of all women in need who were poor adult women rose from 25% in 2000 to 31% in 2014.
Between 2013 and 2014, millions of Americans gained health insurance through provisions of the ACA—either as newly eligible Medicaid enrollees or by purchasing health insurance through the ACA’s health insurance marketplaces. Among poor and low-income women in need of contraceptive services, the change in insurance status was dramatic. Over this one-year period, the number of women in need of publicly funded contraceptive care who had neither public nor private health insurance fell by nearly 20%, from 5.6 million to 4.5 million. The decline in the proportion of women in need who were uninsured was greater among states that had implemented a Medicaid expansion under the ACA than among those states that had not. However, even with these dramatic changes, nearly one in four women (23%) who need publicly funded care remain uninsured.
Moreover, in recent years, the increase in the number of women in need of publicly funded contraceptive services has not been met by a proportionate increase in the number receiving subsidized contraceptive care. Since 2010, the number of women receiving publicly funded contraceptive care has fallen, especially at clinics. The number served by all providers dropped from 8.9 million in 2010 to 7.8 million in 2014, a 13% decline; the number served by clinics fell 22% over the four-year period. Thus, the proportion of need met by all publicly funded providers dropped to 39% in 2014, and the share of need met by clinics fell from 35% in 2010 to 26% in 2014.
Further research is needed to fully understand the factors related to the declining number of women served by publicly funded clinics. In many states and communities, factors related to the supply of clinic services have contributed to this trend: Shrinking government budgets, as well as targeted reductions in funding for specific programs or grantees, have led to clinic closures and reductions in clinic services. In addition to this troubling trend, however, falling demand for clinic services may also have contributed to the decline in clients: An increase in the use of long-acting reversible contraceptives and changing standards for cervical cancer screening have meant that some clients do not need to visit their provider annually for contraceptive supplies or cervical cancer testing and can have their needs met with less frequent visits. In addition, the number of women who receive contraceptive services from private doctors through Medicaid has risen in recent years, likely offsetting some of the decline found among clinics.
Overall, the impact of publicly supported contraceptive services on the prevention of unintended pregnancy in 2014 was significant: Publicly funded contraceptive services helped women to prevent some 1.9 million unintended pregnancies; without these services, the overall U.S. unintended pregnancy rate would have been 68% higher. The contraceptive services provided by clinics alone helped women to prevent some 1.3 million unintended pregnancies, thereby helping women avoid 619,000 unplanned births and 459,000 abortions. Without these services from clinics, the overall U.S. rates of unintended pregnancies, unplanned births and abortions would have been 46% higher, and the teen pregnancy rate would have been 41% higher.
The federal Title X family planning program is critical to the provision of clinic-based contraceptive care. In 2014, clinics funded by this program provided contraceptive services to 3.7 million women, a group representing 71% of all female contraceptive clients served by publicly funded clinics. Not only do Title X–funded clinics typically serve a much greater number of contraceptive clients per year than do other clinics, prior research has documented that Title X clinics offer their clients a greater variety of contraceptive methods, do more to facilitate method initiation and consistent method use among clients, are more likely to advise clients about contraception during annual gynecologic visits, and spend more time counseling clients about contraception and sexual health.16 Title X–funded clinics alone helped women to avert 904,000 unintended pregnancies in 2014—preventing 439,000 unplanned births and 326,000 abortions. Without these services from Title X–funded clinics, the overall U.S. rates of unintended pregnancy, unplanned births and abortion would have been 33% higher, and the teen pregnancy rate would have been 30% higher.
FOOTNOTES
*For the purpose of this report, we use this term to encompass all private providers serving clients enrolled in Medicaid, including a minority who are not physicians.
†These estimates represent the number of women who may need to seek contraceptive services during the year to prevent an unintended pregnancy. They do not represent unmet need for contraception because many of these women are using some contraceptive method.
‡This total varies from the 4.1 million total Title X family planning users reported for 2014 in the Office of Population Affairs’ Family Planning Annual Report because it excludes male clients and clients served in U.S. territories.
REFERENCES
1. Frost JJ, Zolna MR and Frohwirth L, Contraceptive Needs and Services, 2010, New York: Guttmacher Institute, 2013, https://www.guttmacher.org/sites/default/files/report_pdf/contraceptive….
2. Frost JJ, Zolna MR and Frohwirth L, Contraceptive Needs and Services, 2013 Update, New York: Guttmacher Institute, 2015, https://www.guttmacher.org/report/contraceptive-needs-and-services-2013….
3. Frost JJ et al., Return on investment: a fuller assessment of the benefits and cost savings of the U.S. publicly funded family planning program, Milbank Quarterly, 2014, 92(4):667–720.
4. U.S. Census Bureau, State characteristics datasets: annual state resident population estimates for 6 race groups (5 race alone groups and two or more races) by age, sex, and Hispanic origin: April 1, 2010 to July 1, 2014, 2015.
5. U.S. Census Bureau, PUMS Technical Documentation, no date, http://www.census.gov/programs-surveys/acs/technical-documentation/pums….
6. Frost JJ et al., Contraceptive Needs and Services, 2010: Methodological Appendix, New York: Guttmacher Institute, 2013, https://www.guttmacher.org/sites/default/files/pdfs/pubs/win/winmethods….
7. U.S. Census Bureau, Small Area Health Insurance Estimates (SAHIE): 2013–2014 Highlights, Washington, DC: U.S. Government Publishing Office, 2016, http://www.census.gov/did/www/sahie/data/2014/2014highlights.pdf.
8. Fowler CI et al., Family Planning Annual Report: 2014 National Summary, Research Triangle Park, NC: RTI International, 2015.
9. Special tabulations of data from the 2011–2013 National Survey of Family Growth.
10. Zolna MR, special tabulations of background data from Finer LB and Zolna MR, Declines in unintended pregnancy in the United States, 2008–2011, New England Journal of Medicine, 2016, 374(9):843–852.
11. Finer LB and Zolna MR, Declines in unintended pregnancy in the United States, 2008–2011, New England Journal of Medicine, 2016, 374(9):843–852.
12. Kost K and Maddow-Zimet I, U.S. Teenage Pregnancies, Births and Abortions, 2011: National and State Trends by Age, Race and Ethnicity, New York: Guttmacher Institute, 2016.
13. Sonfield A et al., The Social and Economic Benefits of Women’s Ability to Determine Whether and When to Have Children, New York: Guttmacher Institute, 2013, www.guttmacher.org/pubs/social-economic-benefits.pdf.
14. Kavanaugh ML and Anderson RM, Contraception and Beyond: The Health Benefits of Services Provided at Family Planning Centers, New York: Guttmacher Institute, 2013, http://www.guttmacher.org/pubs/health-benefits.pdf.
15. Congressional Budget Office, Trends in Family Wealth, 1989 to 2013, 2016, https://www.cbo.gov/sites/default/files/114th-congress-2015-2016/report….
16. Frost JJ et al., Variation in Service Delivery Practices Among Clinics Providing Publicly Funded Family Planning Services in 2010, New York: Guttmacher Institute, 2012, http://www.guttmacher.org/pubs/clinic-survey-2010.pdf.
Suggested Citation
Frost JJ et al., Contraceptive Needs and Services, 2014 Update, New York: Guttmacher Institute, 2016, https://www.guttmacher.org/report/contraceptive-needs-and-services-2014-update.
Acknowledgments
This report was written by Jennifer J. Frost, Lori Frohwirth and Mia R. Zolna, all of the Guttmacher Institute. It was edited by Haley Ball and Chris Olah. The authors performed all data analyses and tabulations.
The authors thank the following Guttmacher colleagues: Suzette Audam, for assistance in programming and data tabulations of the American Community Survey data; Jonathan Bearak, for assistance in programming and data tabulations of the county-level Small Area Health Insurance Estimates data; Lawrence B. Finer, Rachel B. Gold, Kinsey Hasstedt and Adam Sonfield, for reviewing drafts of the report and tables; and Vivian Gor, for research assistance.
This research was supported by the Office of Population Affairs of the U.S. Department of Health and Human Services under grant FPRPA006058. Additional support was provided by the Guttmacher Center for Population Research Innovation and Dissemination, under National Institutes of Health grant 5 R24 HD074034. The Guttmacher Institute also gratefully acknowledges the general support it receives from individuals and foundations, including major grants from the William and Flora Hewlett Foundation and the David and Lucile Packard Foundation, which undergirds all of the Institute’s work. The views expressed are those of the authors and do not necessarily reflect the official policies or positions of the funder.

Title X Makes a Difference: 2014
