Public Funding for Family Planning and Abortion Services, FY 1980–2015

Author(s)

Kinsey Hasstedt
,
Adam Sonfield
and
Rachel Benson Gold
Reproductive rights are under attack. Will you help us fight back with facts?

Key Points

Key Points
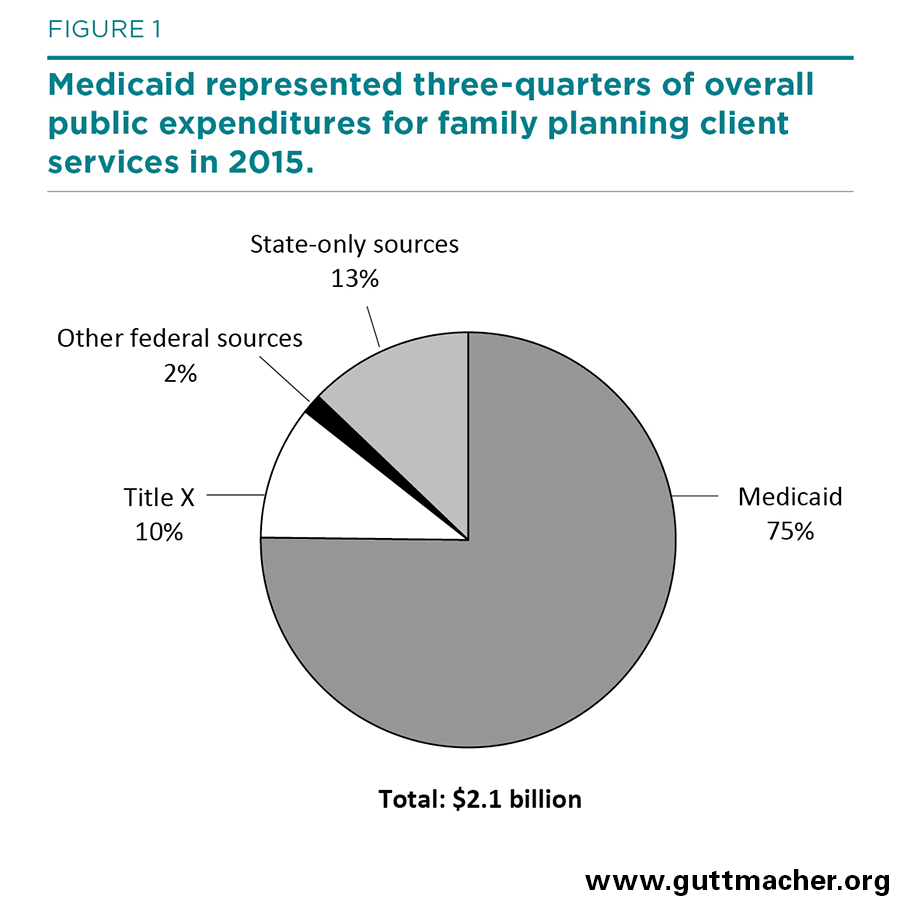
  • Public expenditures for family planning client services totaled $2.1 billion in fiscal year (FY) 2015, supporting the provision of contraceptive drugs and devices, sterilization services, client counseling and education, and tests and treatment, including for STIs. 
  • Medicaid accounted for 75% of the total, state appropriations accounted for 13% and Title X accounted for 10%.
  • Although total public funding in actual dollars has increased by more than $1.7 billion over the last 35 years, after adjusting for inflation, funding levels were essentially the same in FY 2015 as they were in FY 1980. However, reported FY 2015 expenditures appear to substantially undercount Medicaid expenditures.
  • States spent $71 million on about 157,000 abortion procedures for low-income women in FY 2015, almost all of it in states that use their own funds to pay for most or all medically necessary abortions provided to Medicaid recipients. The federal government, which restricts funding to cases of life endangerment, rape and incest, contributed to the cost of only 160 of those procedures.

BACKGROUND

The federal and state governments have long subsidized family planning services, and to a lesser extent abortion, for low-income individuals in the United States. Public funding for family planning services comes from a variety of sources. The relative importance of these sources differs considerably according to how each state’s policymakers have decided to fund their family planning effort.

Family Planning


Title X of the Public Health Service Act. The federal government’s targeted family planning program provided grants in fiscal year (FY) 2015 to 36 state agencies and 38 nonstate organizations (such as regional family planning councils, Planned Parenthood affiliates and community health agencies).1 Collectively, the health centers supported by the program provide care to uninsured and underinsured clients in all 50 states and the District of Columbia, and the program sets a high standard for family planning provision across the country.

Medicaid. This joint federal-state insurance program provides coverage for a broad package of medical care to millions of low-income individuals and families. Family planning services and supplies are covered for all program enrollees, and states are reimbursed for such services by the federal government at an enhanced 90% rate (compared with 50–75% for most other services). Some funding for family planning also comes from Medicaid’s companion program, the Children’s Health Insurance Program (CHIP). 

Since the mid-1990s, many states have expanded eligibility for Medicaid coverage specifically for family planning services. Historically, states have expanded the program by securing approval of a "waiver" of federal policy from the Centers for Medicare and Medicaid Services (CMS). Most of these expansion states provide coverage for family planning solely on the basis of income to individuals not previously covered under Medicaid. More recently, the Affordable Care Act (ACA) gave each state the authority to expand its program’s eligibility for family planning services by amending its state Medicaid plan. Unlike a waiver, which is time-limited, a state plan amendment is a permanent change to the state’s Medicaid program. By the middle of FY 2015, 25 states had either a family planning waiver or a state plan amendment in place.2 

Federal block grants. Federal law specifically allows states to fund family planning services through three major grants provided to agencies in every state, although the funds are often passed on to other public and private agencies. The maternal and child health (MCH) block grant (also known as Title V of the Social Security Act) is provided to each state’s health agency; states are required by federal law to match every four federal MCH dollars with three state dollars. Two other grants are provided to each state’s social services agency: the social services block grant (SSBG, or Title XX of the Social Security Act) and Temporary Assistance for Needy Families (TANF, the main federal source of financial "welfare" aid); neither grant requires a state match. Because federal law allows states to transfer a portion of their TANF allotment to the SSBG, the funding for these two programs is essentially interchangeable.

State-only sources. Most states use some of their own money (in addition to funds required to match federal grants) for family planning services. For example, Medicaid agencies in some states dedicate their own funds to provide services to groups of people, such as many immigrants, who are barred from receiving federally reimbursed Medicaid.

Abortion

The policies governing public funding for abortions, and thus the number of abortions funded, vary tremendously by state. Most states have highly restrictive policies and typically provide only the state match for abortions that must be covered for Medicaid recipients under federal law: pregnancies that threaten the life of the woman or are the result of rape or incest. (A few states with restrictive policies also provide funding in additional rare circumstances, such as in cases of fetal anomaly.) In FY 2015, 17 states officially had nonrestrictive policies, using their own funds to pay for most or all medically necessary abortions provided to Medicaid recipients (see Table 4 for a list of the states). Four of these states had voluntarily adopted such a policy; the remainder were under court orders saying that less extensive coverage was in violation of their state constitutions.3 As noted in the Discussion section below, it appears that two of the 17 states (Arizona and Illinois) are not actually covering most or all medically necessary abortions, despite their official policy.


METHODOLOGY


This report presents the results of a survey of FY 2015 public expenditures for family planning client services and abortion services. We look at expenditures nationally, for each state and for each funding source. We also compare FY 2015 data for family planning client services with those from a series of prior surveys between FY 1980 and FY 2010.4–14 As in past reports, we also look at data on abortion utilization.

Fielding, Response and Survey Instruments

In January 2016, questionnaires were sent via e-mail to the health, social services and Medicaid agencies in all 50 states and the District of Columbia, as well as to 38 nonstate Title X grantees that were identified by the federal Office of Population Affairs as administering the provision of clinical services. Contacts that had not responded received a second round of e-mails, followed by personal contact via telephone and e-mail, to obtain clarification and additional data. Fieldwork continued through January 2017.

Responses were obtained from health agencies in 41 states and the District of Columbia, social services agencies in 34 states, Medicaid agencies in 39 states and the District of Columbia, and 31 of the nonstate Title X agencies.* In those cases in which state agencies did not or could not respond, we used other resources, such as Title X grant amounts provided by the Office of Population Affairs or older data adjusted for inflation. We obtained Medicaid and CHIP expenditure data directly from CMS, which administers the programs on a national level.

Four similar questionnaires were designed, one for each type of respondent: nonstate Title X grantees and state health, social services and Medicaid agencies. The first three questionnaires requested data on total expenditures from various funding sources for family planning–related services and activities in FY 2015, as well as the amount spent specifically on family planning client services, sterilization services, outreach and education activities, and administrative expenses. The list of funding sources differed depending on the particular agency. Sources included Title X, the MCH block grant, TANF and SSBG, other federal funding sources (not including Medicaid or CHIP) and state appropriations (which include a variety of state and local monies but specifically exclude state funds used to match federal grants, which we asked states to include with the appropriate grant). We also asked the health and social services agencies about the amount of state appropriations spent on abortions and the number of abortions funded.

Because we obtained data on federally reimbursed Medicaid expenditures from CMS, the questionnaire for Medicaid agencies asked about state-only expenditures by the agency (expenditures for which no federal reimbursement was claimed) on family planning services and supplies, sterilization services and abortion services. The questionnaire also included several questions about managed care coverage under Medicaid, to assist with estimating family planning client services expenditures under capitated plans (see Medicaid Managed Care section below).

Terminology and Data Analysis


Throughout this report, we use the term "family planning client services" to refer to the package of direct patient care services provided through family planning programs to clients receiving reversible contraceptives or sterilization services. Family planning client services include client counseling and education, contraceptive drugs and devices, related diagnostic tests (e.g., those for pregnancy, Pap, HIV and other STIs) and treatment after diagnosis (e.g., for urinary tract infections and STIs other than HIV). For this iteration of the survey, we have combined sterilization services with other family planning client services and are no longer reporting them separately. 

Whenever possible, we separated out services that are not part of the standard package provided to clients seeking contraceptives, such as outreach and education activities and administrative expenses. CMS provided data according to a similar definition of family planning services for every state’s Medicaid program. Data obtained from state agencies and Title X grantees for the other funding sources, however, often included some outreach, education and administrative expenses, as noted in the tables.

In presenting our findings, we in many cases combined data obtained from multiple agencies. When one or more agencies reported a nonzero expenditure, we included such expenditures, even if other agencies did not respond to the question or told us that an unknown amount had been spent. When no agency reported a nonzero expenditure but at least one agency reported that an unknown amount had been spent, we labeled expenditures under that funding source as unknown. When some of the agencies reported no expenditures and others did not respond, we listed the data provided by the agency that typically has primary responsibility for the given funding source: the social services agency for TANF and SSBG, and the health and Medicaid agencies, jointly, for state and local funding sources.

All expenditure data in the tables have been rounded to the nearest 1,000; state totals, therefore, do not always sum to the national total. For years starting in FY 1987, data include sterilization (such data were not available for FY 1980). For years starting in FY 2001, Medicaid includes CHIP expenditures; CHIP did not exist in prior survey years. Data for Medicaid and the MCH block grant include matching funds provided by states. No relevant expenditures were reported for other federal sources for FY 2015. 

A number of respondents indicated that some or all of their data were not calculated for the federal fiscal year 2015 (October 1, 2014, through September 30, 2015), as requested, but rather for either the calendar year or the state’s fiscal year, which for most states ran from July 1, 2014, through June 30, 2015. For the sections in which states are grouped according to state policy (e.g., policies on public funding for abortion), we used state policies that were in place as of the midpoint of the given federal fiscal year (e.g., April 1, 2015). 

Comparative data from prior years are culled from prior published articles.4–14 For the section in which we compare data over time for family planning services in constant dollars, we converted data to constant 2015 dollars using the Medical Care Consumer Price Index–All Urban Consumers, with $1.00 in 2015 equal to $5.96 in 1980.15

Medicaid Managed Care


A previous survey in this series, from FY 1994, identified a serious methodological problem that has grown over time: Most states now rely on private-sector managed care plans to operate their Medicaid programs. Although states have a financial incentive to keep track of expenditures for family planning services, given the special 90% federal matching rate, not all states are able to identify family planning services provided through capitated managed care plans (i.e., plans that are paid a set amount per patient, rather than by specific service). This results in what is likely a serious undercount of expenditures.

For the studies starting in FY 2001, we have taken several steps to assess this potential undercount and adjust for it when necessary and feasible. First, based on an in-depth study we commissioned of Medicaid expenditures in four states, we determined that women enrolled in capitated managed care plans and in fee-for-service plans received a similar number of contraceptive services each year. Thus, expenditure data could be adjusted using the proportion of clients in the state enrolled in capitated managed care as an inflator.16

Because some women in capitated managed care, however, receive family planning services outside of their plan using a federally required "freedom of choice" option, a further adjustment was needed. (Expenditures for freedom of choice services are reported as fee-for-service and do not need to be estimated.) No data are available on the frequency with which freedom of choice is utilized, but ongoing discussions with family planning providers and state officials have led us to conclude that the proportion of women making use of this option is small. For FY 2015, we have estimated that 10% of women enrolled in capitated plans received freedom of choice services, and we created a final adjustment factor based on 90% of the capitated enrollment. 

Second, to help us decide when and how to apply the correction factor, we used state-level data from the Kaiser Family Foundation’s Medicaid Managed Care Market Tracker on whether states reported having contracts with Medicaid managed care organizations as of September 2015.17 In states with managed care, we estimated the capitation rate by averaging two figures: Kaiser’s reported average of the proportion of adult enrollees in traditional Medicaid who were in capitated managed care plans (excluding "aged and disabled" adults), and the proportion of adults who qualified for coverage under the ACA’s Medicaid expansion enrolled in capitated managed care plans, both as of July 1, 2016.18 This was the best available data with which to approximate the proportion of female Medicaid enrollees of reproductive age in capitated managed care plans in each state for FY 2015.  

Third, in our survey of state Medicaid agencies, we asked states that had reproductive-age women enrolled in capitated plans to tell us whether they claimed federal reimbursement at the 90% rate for family planning services provided to those women. Depending on the response, we determined how much the CMS Medicaid expenditure data needed to be adjusted for each state. For those states that reported no capitated managed care enrollment or that reported claiming their capitated expenses at the 90% rate, we used the CMS expenditure data. Similarly, we used CMS expenditure data for states that did not respond to the FY 2015 survey but had either: (1) previously reported no capitated managed care enrollment and Kaiser reported the state still had no managed care contracts in September 2015, or (2) previously reported claiming their capitated expenses at the 90% rate and we had no reason to believe that had changed. 

For a number of states, however, we adjusted the CMS data upward. For seven states (Florida, Hawaii, Illinois, Kansas, Mississippi, Utah and West Virginia) and the District of Columbia, information provided for this or earlier surveys indicated that none or only some of the family planning services provided to enrollees of capitated managed care were claimed at the 90% rate. For these eight jurisdictions, we adjusted expenditures using an inflator equal to 90% of the capitation rate, as described above. (In making this adjustment, we excluded CMS-reported expenditures via Medicaid waiver programs, because such expenditures are reported as fee-for-service.) We adjusted expenditures using this same methodology in one additional state (North Dakota) that did not respond to the FY 2015 survey, but where Kaiser data showed the state had implemented capitated managed care enrollment since the last survey response.

In total, the adjustments made for these eight states and the District of Columbia resulted in a nationwide increase of 5% in estimated Medicaid expenditures for family planning services for FY 2015. 

We did not receive responses from the state Medicaid agency in five additional states and so had no information on whether family planning services provided to enrollees of their capitated plans were claimed at the 90% rate. We did not adjust the data for these states for one of two reasons: For California and New Hampshire, the adjustment was not feasible because the state had a Medicaid family planning state plan amendment and (unlike for states with Medicaid family planning waivers) we could not separate out those expenditures. For Iowa, Nebraska and Wisconsin, our method of adjustment projected Medicaid family planning expenditures that were unreasonably high, indicating that the state most likely had already properly claimed the 90% match for family planning services under managed care.

Limitations


The findings in this report represent the most complete summary of public funding available, but they have limitations. As a result, the report should be seen as providing an approximation, rather than a precise accounting, of dollars spent.

In addition to the funding sources analyzed in this report, there are several others that may have some impact. A relatively small amount of public expenditures for family planning services may have been spent through Medicare for disabled clients who are of reproductive age. It is likely that more substantial expenditures for family planning services are made each year through the Indian Health Service and through funding for federally qualified health centers under Section 330 of the Public Health Service Act. Clinics receiving funding through these two programs do provide family planning services; however, many of their clients are covered under Medicaid or have their services subsidized via other sources of funding, such as Title X, and data are not available on the extent to which these clinics spend Indian Health Service or Section 330 dollars on these services.

The adjustments we made for capitated managed care plans under Medicaid are imprecise, and it is possible that costs per family planning client are different under managed care plans than under fee-for-service Medicaid. It is also possible that capitated managed care affected our estimates of Medicaid expenditures for abortion services among those states that fund medically necessary abortions. (Federally reimbursed abortions have strict reporting requirements, regardless of capitation, and expenditure data on such abortions should therefore be reported in full.) We had no basis, however, upon which to adjust for these potential variations. 

More broadly, many states have moved entirely or almost entirely to managed care. Therefore, fee-for-service has disappeared almost entirely in these states. This has made our adjustment to account for managed care increasingly difficult and unreliable. We attempted to make estimates for several states based on a limited amount of fee-for-service data, leading to estimates that seem very small for some states and estimates that seem too large for others. Moreover, for FY 2015, CMS reported no fee-for-service expenditures in one state, making it impossible for us to make a meaningful adjustment.

FINDINGS


The findings highlighted in this section reflect the major national trends in public funding for family planning client services and for abortion services over the past 35 years. Please refer to the tables for state-by-state data.

Family Planning Client Services

Expenditures in FY 2015

  • Public expenditures for family planning client services totaled $2.1 billion in FY 2015 (Table 1). 
  • Medicaid accounted for 75% of the total, whereas state-only sources accounted for 13% and Title X accounted for 10%. Together, other federal funding sources such as the MCH block grant, SSBG and TANF accounted for 2% of total funding (Figure 1).
  • Medicaid and Title X are utilized in every state, while other federal funding sources are less commonly used. Only 22 states reported using the MCH block grant for family planning, and only 12 reported using SSBG or TANF funds.
  • Most states (38 states and the District of Columbia) reported spending some amount of state or local funds (besides funds required to match federal spending under Medicaid and other programs). 


Trends in expenditures, FY 1980–FY 2015

  • Actual public expenditures on family planning client services rose from $350 million in FY 1980 to $2.1 billion in FY 2015 (Table 2). 
  • Accounting for inflation, public funding for family planning client services was essentially the same in FY 2015 as it was in FY 1980 (Table 3). Funding dropped in the early 1980s and only again reached FY 1980 levels in the last 15 years.
     

Abortion Services

  • State governments funded 157,000 abortion procedures for low-income women in FY 2015. The federal government reported contributing to the cost of 160 procedures, while the remainder were funded entirely with state dollars (Table 4). Public expenditures totaled $71 million.
  • Virtually all publicly funded abortion procedures (more than 99%) occurred in the 17 states that have nonrestrictive policies on funding for Medicaid recipients. 
  • However, in two of these states (Arizona and Illinois), the number of reported state-funded abortions is extremely small, suggesting that the states are not actually covering most or all medically necessary abortions as required under their stated policies.


DISCUSSION

At a reported $2.1 billion, public funding for family planning client services in FY 2015 was essentially equal to inflation-adjusted FY 1980 levels, having recovered from deep cuts made during the early 1980s. 

However, the estimate for FY 2015 was lower than for FY 2010. That apparent decline is almost certainly due to missing data from several key states and underreported Medicaid expenditures. Medicaid enrollment between FY 2010 and FY 2015 increased substantially. Just from 2013 to 2015—before and after implementation of the ACA’s Medicaid expansion—the number of reproductive-age women enrolled in Medicaid increased by 24%.19    

Medicaid has become firmly established as the dominant source of public family planning funds in the United States, accounting for three-quarters of all such spending in FY 2015, as it did in FY 2010. This makes sense, given that Medicaid has become the nation’s single largest payer of medical services and considering the demographics of the program’s enrollees. According to a Guttmacher Institute analysis of U.S. Census Bureau data, 20% of U.S. women of reproductive age are enrolled in Medicaid, including 48% of those living below the poverty level.20 (The poverty level is currently $20,420 for a family of three.21) Medicaid has provided for robust coverage of family planning services and supplies since its inception, and the ACA enabled many states to expand their programs. In addition, states’ Medicaid family planning expansions have contributed to an increase in clients served and accompanying spending, and continue to serve an important function by filling gaps in coverage that persist despite the advances of the ACA—particularly for people living in states that still severely limit eligibility for broad-benefit Medicaid.   

Still, the Title X program, state-only sources and federal block grants all continue to play important roles in individual states, for safety-net providers and particularly for patients who are not covered by Medicaid. State agencies and family planning providers value these funding sources because of their flexibility. This is particularly true for Title X, which bolsters access to safety-net family planning services in all 50 states and the District of Columbia. Unlike Medicaid, Title X funds are not usually tied to individual clients, and can be used by providers to help cover the cost of uncompensated care, for outreach and education activities, and to support clinic staffing and infrastructure. Moreover, the Title X program sets nationwide standards for publicly supported family planning services, ensuring that all services are comprehensive, voluntary, confidential and affordable. 

As has been the case for many years, 17 states have a policy (either voluntarily or by court order) requiring the use of state funds to cover abortions for low-income women enrolled in Medicaid. However, our findings continue to suggest that only 15 states are doing so in practice. As we have found previously, Arizona and Illinois fund so few abortions that they appear to be in violation of their court orders. The 15 states that are funding abortions with state dollars account for virtually all publicly funded abortions in the United States. 

Together, federal and state public funding programs are critical—and promise to remain so in the future—to ensuring that the millions of people who rely on safety-net family planning providers are able to obtain timely, high-quality care.

FOOTNOTES

*Agencies that did not respond: health agencies in California, Georgia, Indiana, Mississippi, New Jersey, North Dakota, Oklahoma, South Dakota and Utah; social services agencies in Arkansas, Colorado, Connecticut, District of Columbia, Georgia, Maryland, Michigan, Mississippi, New Hampshire, New Jersey, New York, North Dakota, Ohio, Oregon, South Dakota, Texas and Wisconsin; Medicaid agencies in California, Florida, Iowa, Kansas, Nebraska, New Hampshire, New Jersey, North Dakota, Ohio, South Dakota and Wisconsin; and nonstate Title X agencies in Arizona, Arkansas, Illinois, Massachusetts, Minnesota, Nevada and New York.

REFERENCES

1. Office of Population Affairs, U.S. Department of Health and Human Services (HHS), Family planning program: FY 2015 service program grants by state, Washington, DC: HHS, 2016.

2. Guttmacher Institute, Medicaid family planning eligibility expansions, State Policies in Brief (as of April 2015), 2015.

3. Guttmacher Institute, State funding of abortion under Medicaid, State Policies in Brief (as of April 2015), 2015.

4. Sonfield A and Gold RB, Public Funding for Family Planning, Sterilization and Abortion Services, FY 1980–2010, New York: Guttmacher Institute, 2012, https://www.guttmacher.org/report/public-funding-family-planning-steril….

5. Sonfield A, Alrich C and Gold RB, Public funding for family planning, sterilization and abortion services, FY 1980–2006, Occasional Report, New York: Guttmacher Institute, 2008, No. 38, https://www.guttmacher.org/sites/default/files/pdfs/pubs/2008/01/28/or3….

6. Sonfield A and Gold RB, Public Funding for Contraceptive, Sterilization and Abortion Services, FY 1980–2001, New York: Guttmacher Institute, 2005.

7. Sollom T, Gold RB and Saul R, Public funding for contraceptive, sterilization and abortion services, 1994, Family Planning Perspectives, 1996, 28(4):166–173.

8. Daley D and Gold RB, Public funding for contraceptive, sterilization and abortion services, fiscal year 1992, Family Planning Perspectives, 1993, 25(6):244–251.

9. Gold RB and Daley D, Public funding of family planning services, sterilization and abortion services, 1990, Family Planning Perspectives, 1991, 23(5):204–211.

10. Gold RB and Guardado S, Public funding of family planning, sterilization and abortion services, 1987, Family Planning Perspectives, 1988, 20(5):228–233.

11. Gold RB and Macias J, Public funding of contraceptive, sterilization and abortion services, 1985, Family Planning Perspectives, 1986, 18(6):259–264.

12. Gold RB and Nestor B, Public funding of contraceptive, sterilization and abortion services, 1983, Family Planning Perspectives, 1985, 17(1):25–30.

13. Nestor B and Gold RB, Public funding of contraceptive, sterilization and abortion services, 1982, Family Planning Perspectives, 1984, 16(3):128–133.

14. Nestor B, Public funding of contraceptive services, 1980–1982, Family Planning Perspectives, 1983, 14(4):198–203.

15. Bureau of Labor Statistics, Consumer Price Index–All Urban Consumers (Current Series), 2015, https://www.bls.gov/cpi/home.htm.

16. The MEDSTAT Group, Selected state Medicaid family planning services cost and use measures: an empirical study, unpublished report, Ann Arbor, MI: The MEDSTAT Group, 2002.

17. Kaiser Family Foundation, Total Medicaid MCOs, 2016, State Health Facts, http://kff.org/data-collection/medicaid-managed-care-market-tracker/.

18. Kaiser Family Foundation, Medicaid managed care penetration rates by eligibility group, 2016, State Health Facts, http://kff.org/data-collection/medicaid-managed-care-market-tracker/.

19. Frohwirth L, Guttmacher Institute, special analysis of data from the 2016 American Community Survey.

20. Guttmacher Institute, Uninsured rate among women of reproductive age has fallen more than one-third under the Affordable Care Act, News in Context, Nov. 17, 2016, https://www.guttmacher.org/article/2016/11/uninsured-rate-among-women-r….

21. Office of the Assistant Secretary for Planning and Evaluation, HHS, Poverty guidelines, 2017, https://aspe.hhs.gov/poverty-guidelines.

Suggested Citation

Hasstedt K, Sonfield A and Gold RB, Public Funding for Family Planning and Abortion Services, FY 1980–2015, New York: Guttmacher Institute, 2017, https://www.guttmacher.org/report/public-funding-family-planning-abortion-services-fy-1980-2015.

Acknowledgments

This report was written by Kinsey Hasstedt, Adam Sonfield and Rachel Benson Gold. The report was edited by Chris Olah. The authors thank Andrea Rowan for contributing to the study design and implementing initial stages of research; Leah Koenig and Jamie Quam for substantial research assistance; and Zohra Ansari-Thomas and Leah Keller for additional research and editing assistance. The authors also thank Jennifer J. Frost for reviewing a draft of the report. All are currently or formerly affiliated with the Guttmacher Institute.

Special thanks are due to the officials from the federal government and numerous states across the country who provided data and information about their family planning programs.

This research was supported in part by the U.S. Department of Health and Human Services under grant FPR PA-006058.

The Guttmacher Institute gratefully acknowledges the unrestricted funding it receives from many individuals and foundations—including major grants from the William and Flora Hewlett Foundation and the David and Lucile Packard Foundation—which undergirds all of the Institute’s work.