Trends and Differentials in Receipt of Sexual and Reproductive Health Services in the United States: Services Received and Sources of Care, 2006–2019

Author(s)

, and
Zoe H. Pleasure
Reproductive rights are under attack. Will you help us fight back with facts?

Key Points

Key Points
  • Seven in 10 U.S. women of reproductive age, some 44 million women, make at least one medical visit to obtain sexual and reproductive health (SRH) services each year.
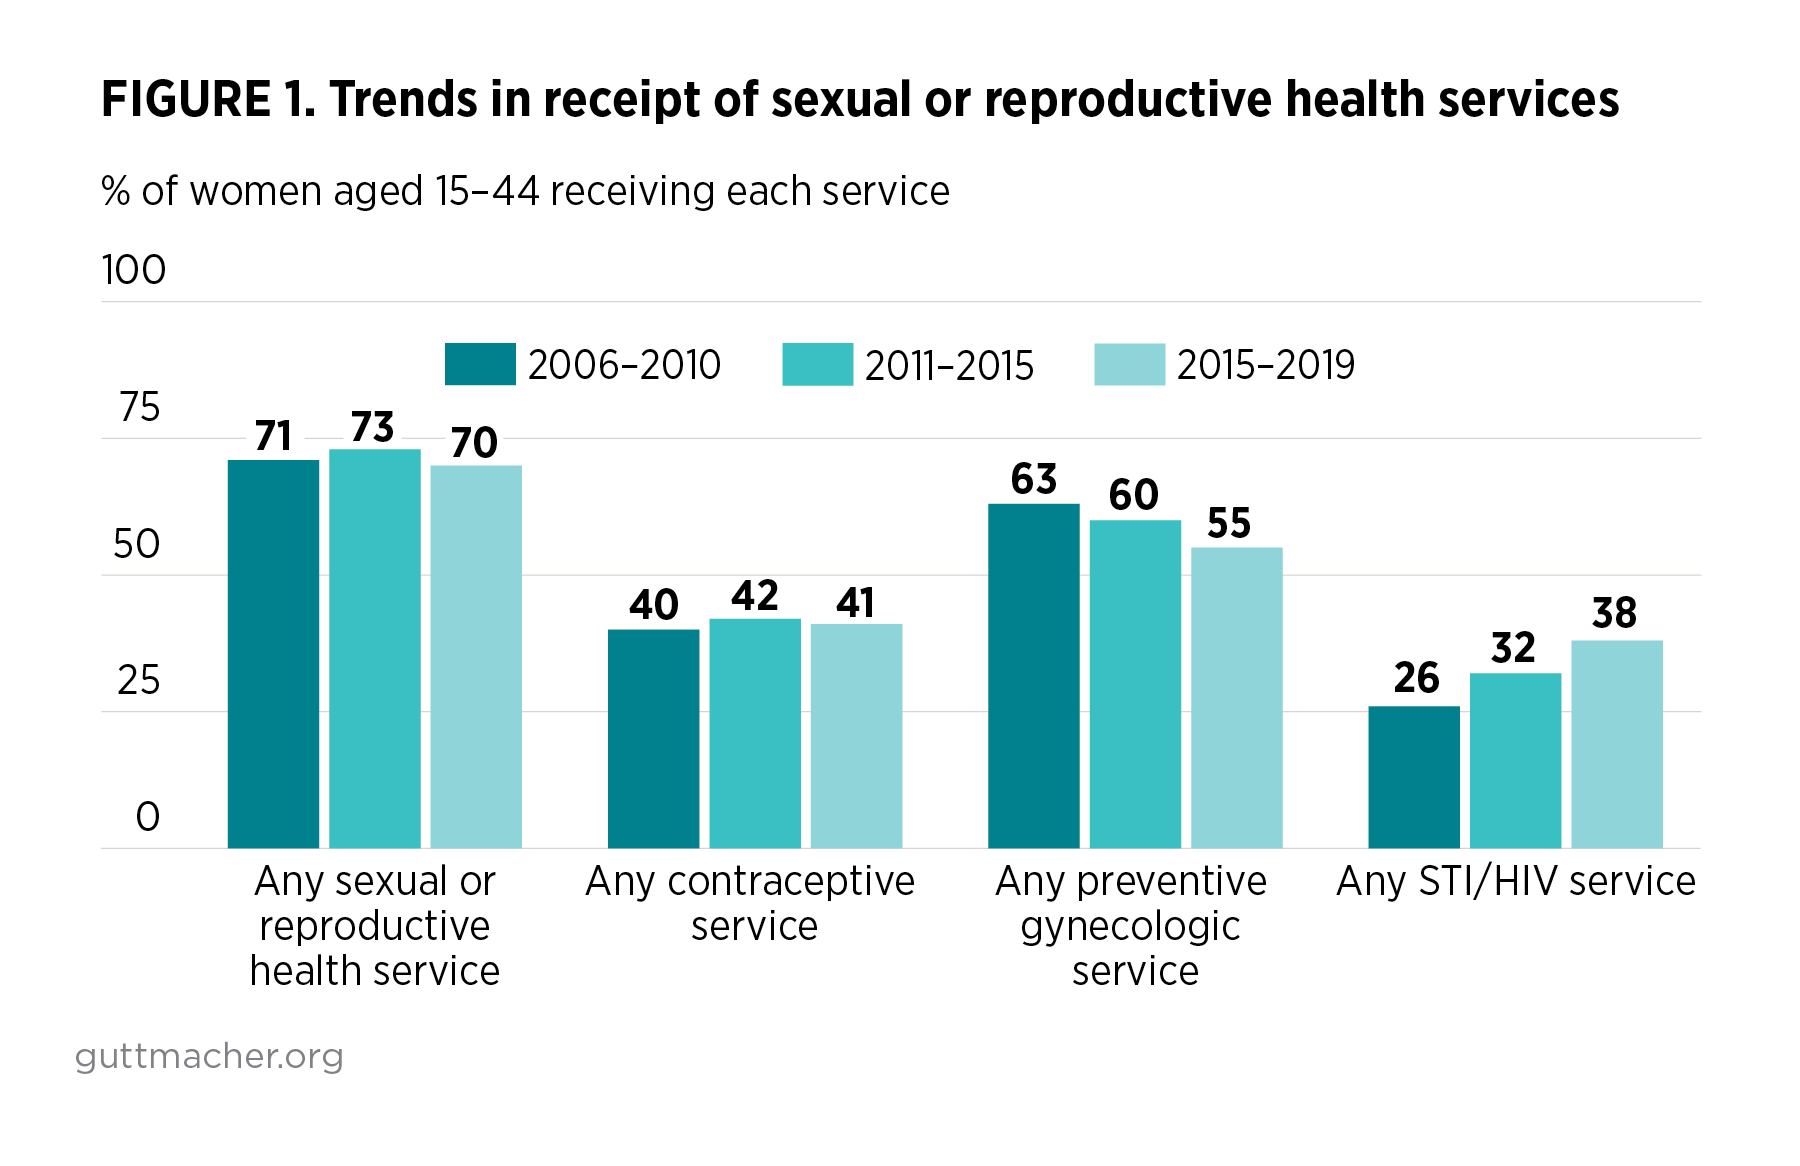
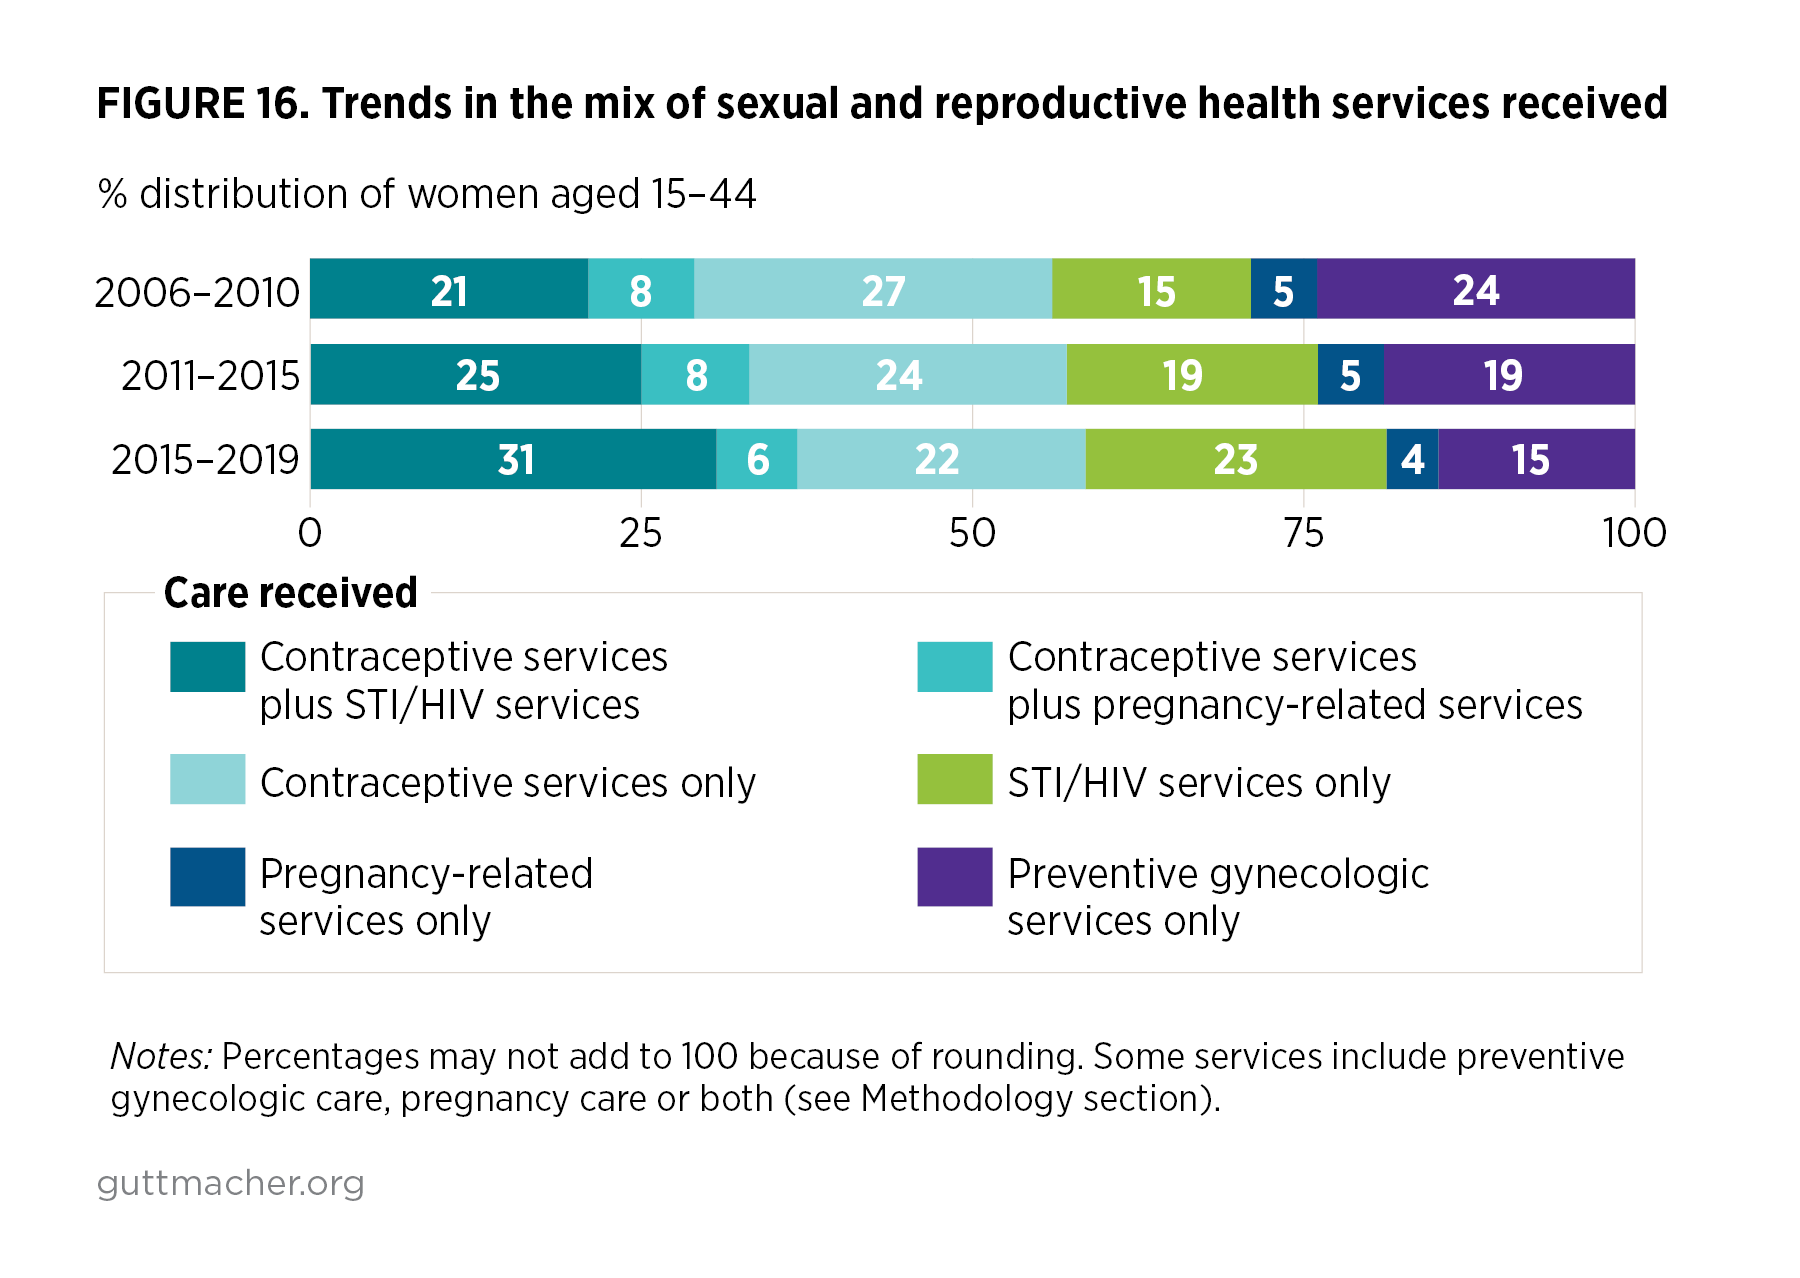
  • While the overall number of women receiving any SRH service remained relatively stable between 2006–2010 and 2015–2019, the number of women receiving preventive gynecologic care fell and the number receiving STI testing doubled.
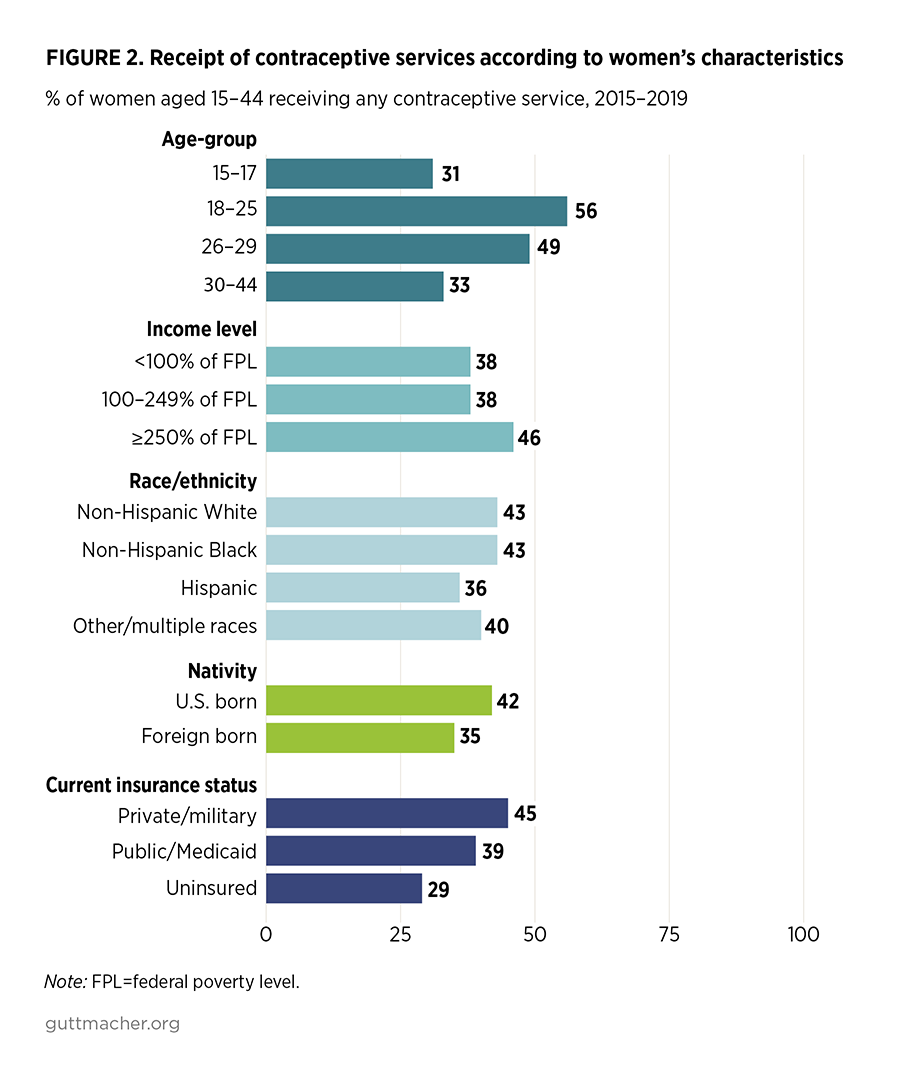
  • Disparities in use of SRH services persist, as Hispanic women are significantly less likely than non-Hispanic White women to receive SRH services, and uninsured women are significantly less likely to receive services than privately insured women.
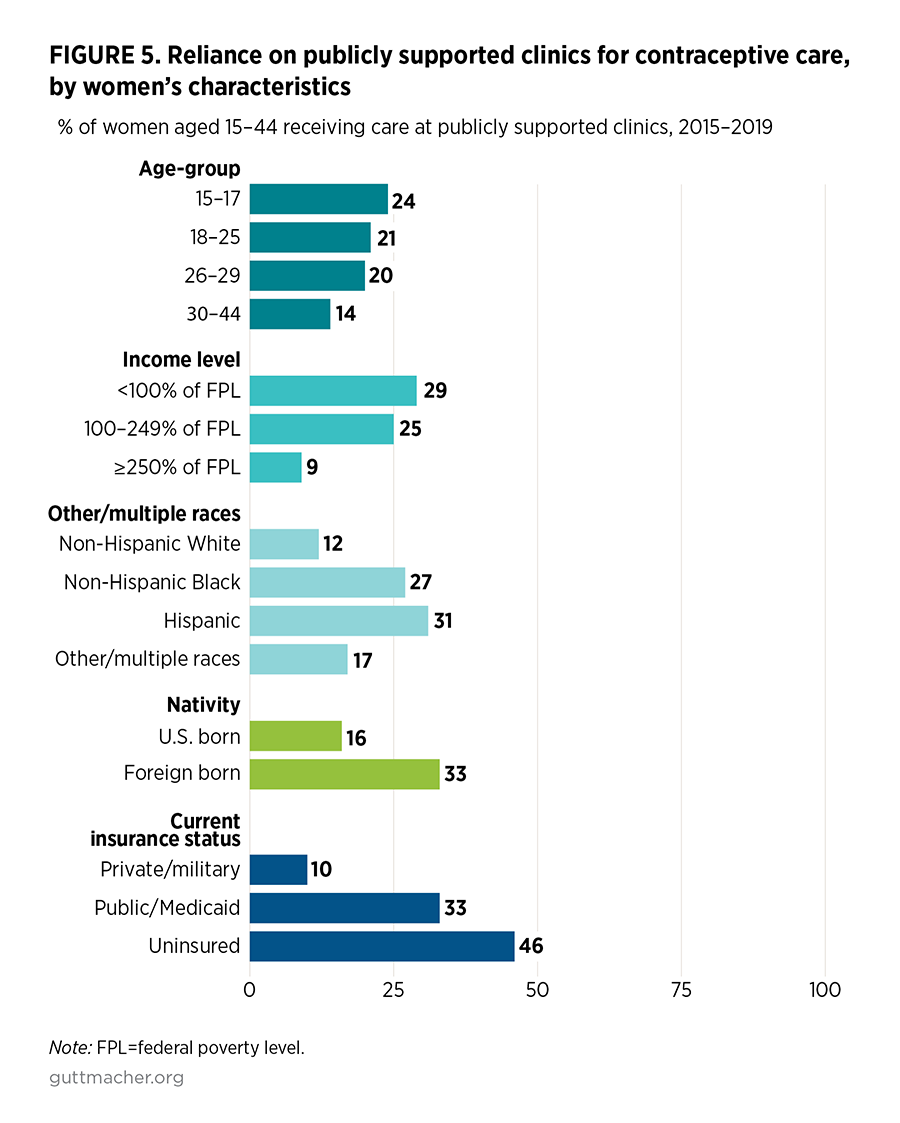
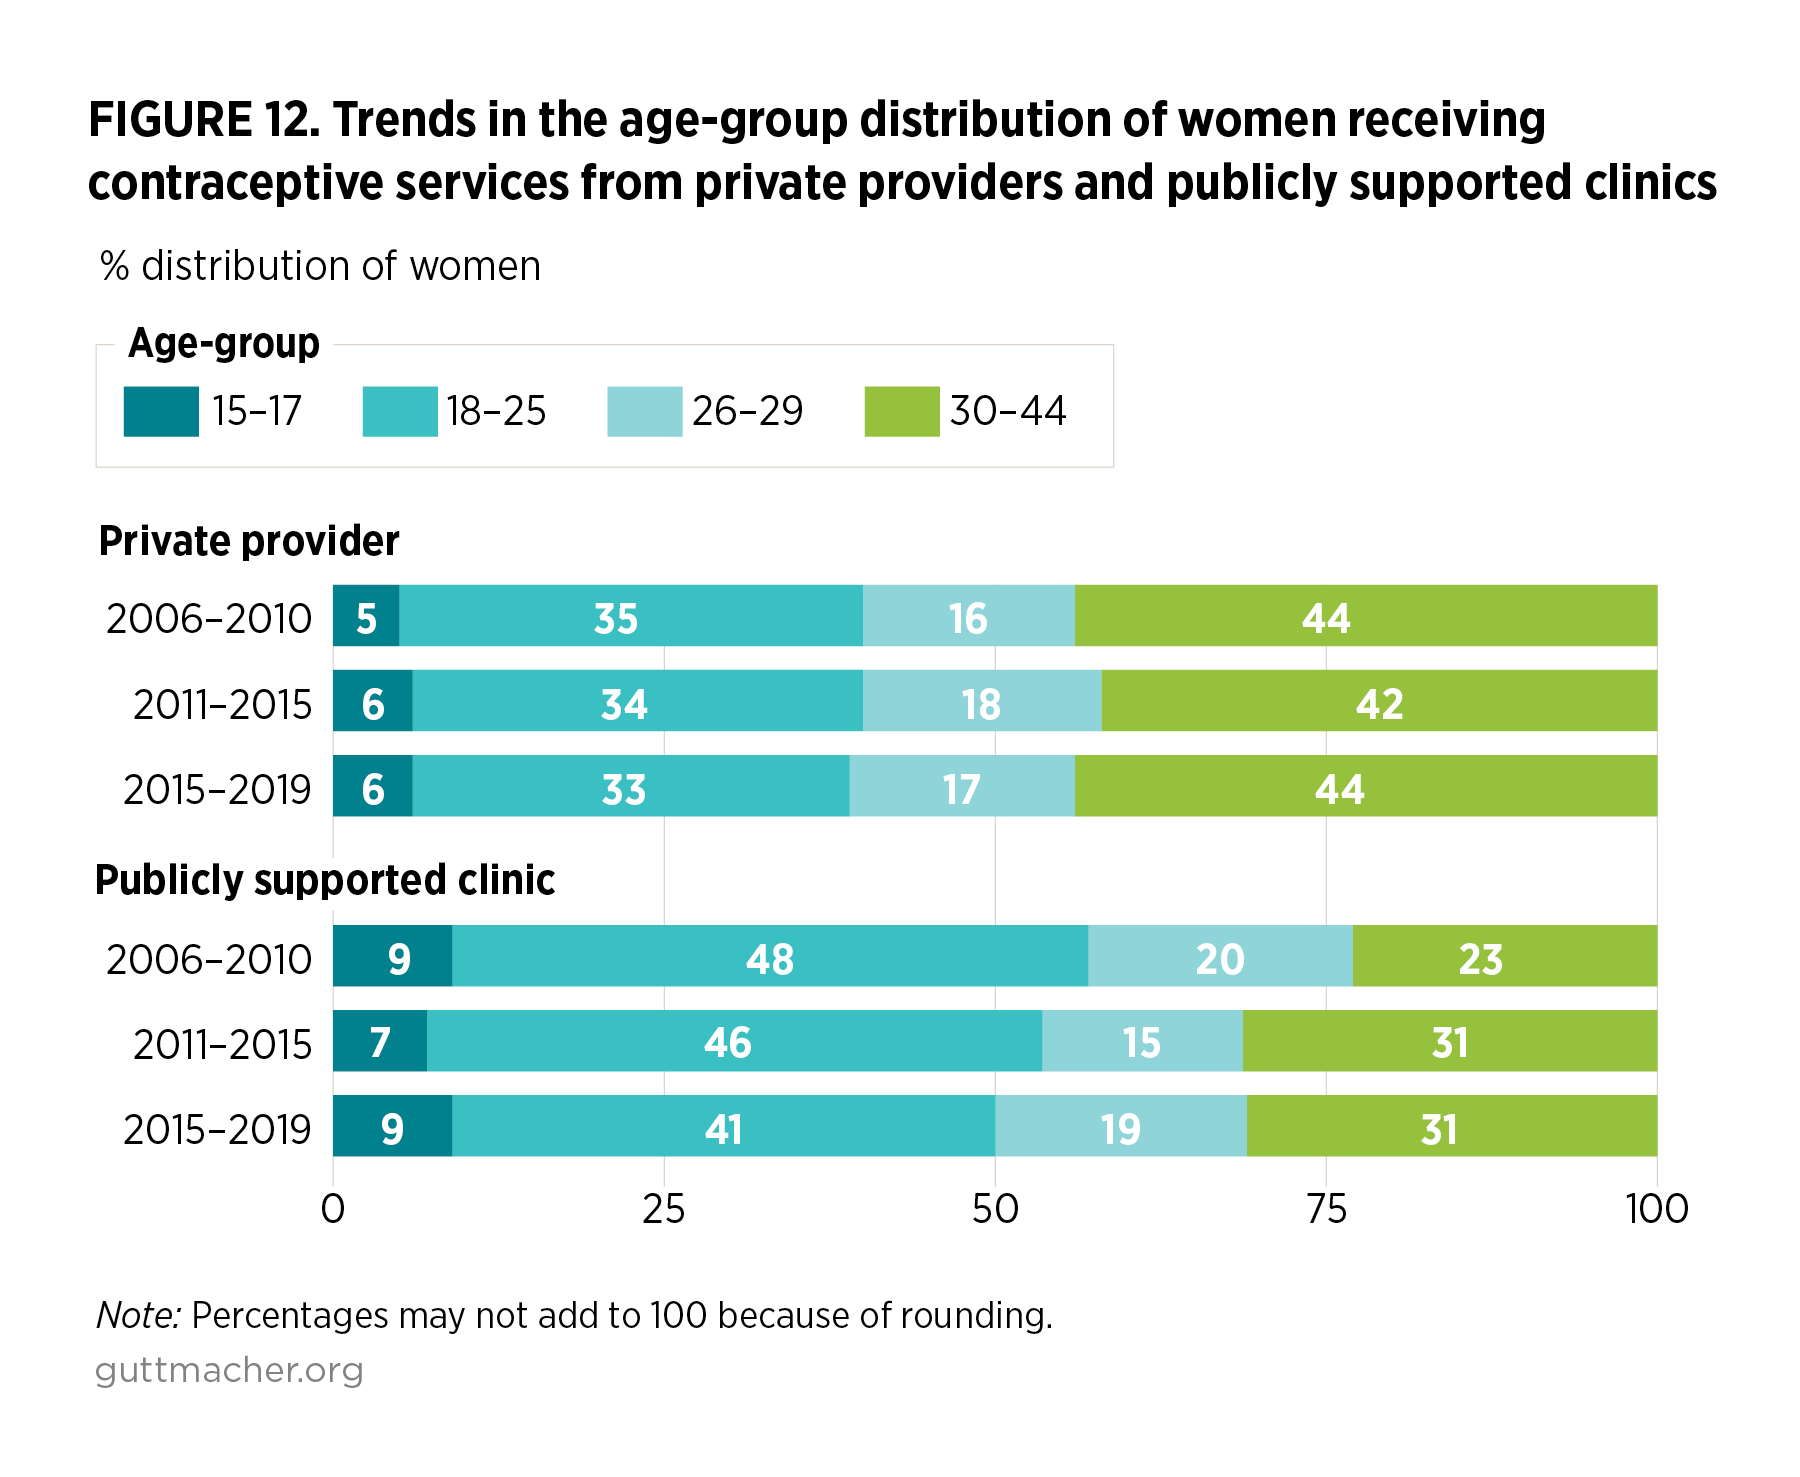
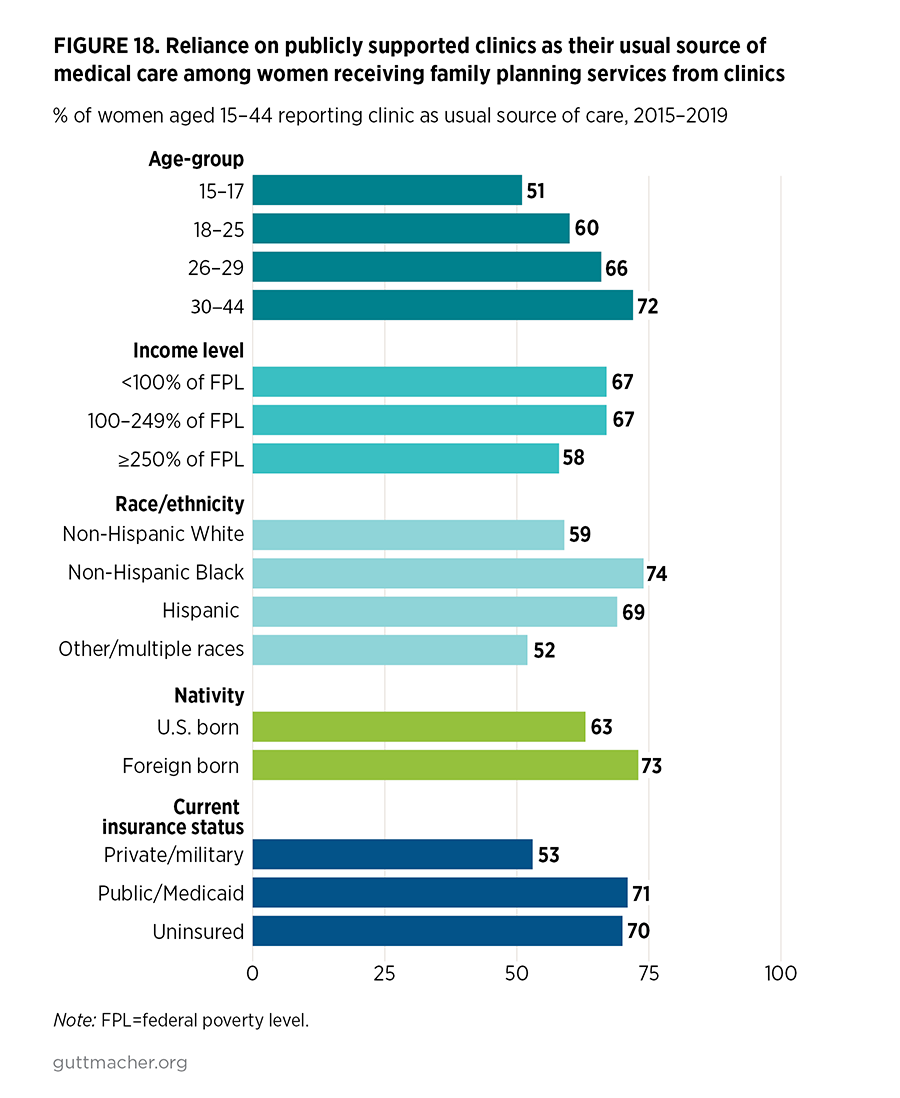
  • Publicly funded clinics remain critical sources of SRH care for many women, with younger women, lower income women, women of color, foreign-born women, women with Medicaid coverage and women who are uninsured especially likely to rely on publicly funded clinics. Among women who go to clinics for SRH care, two-thirds report that the clinic is their usual source for medical care.
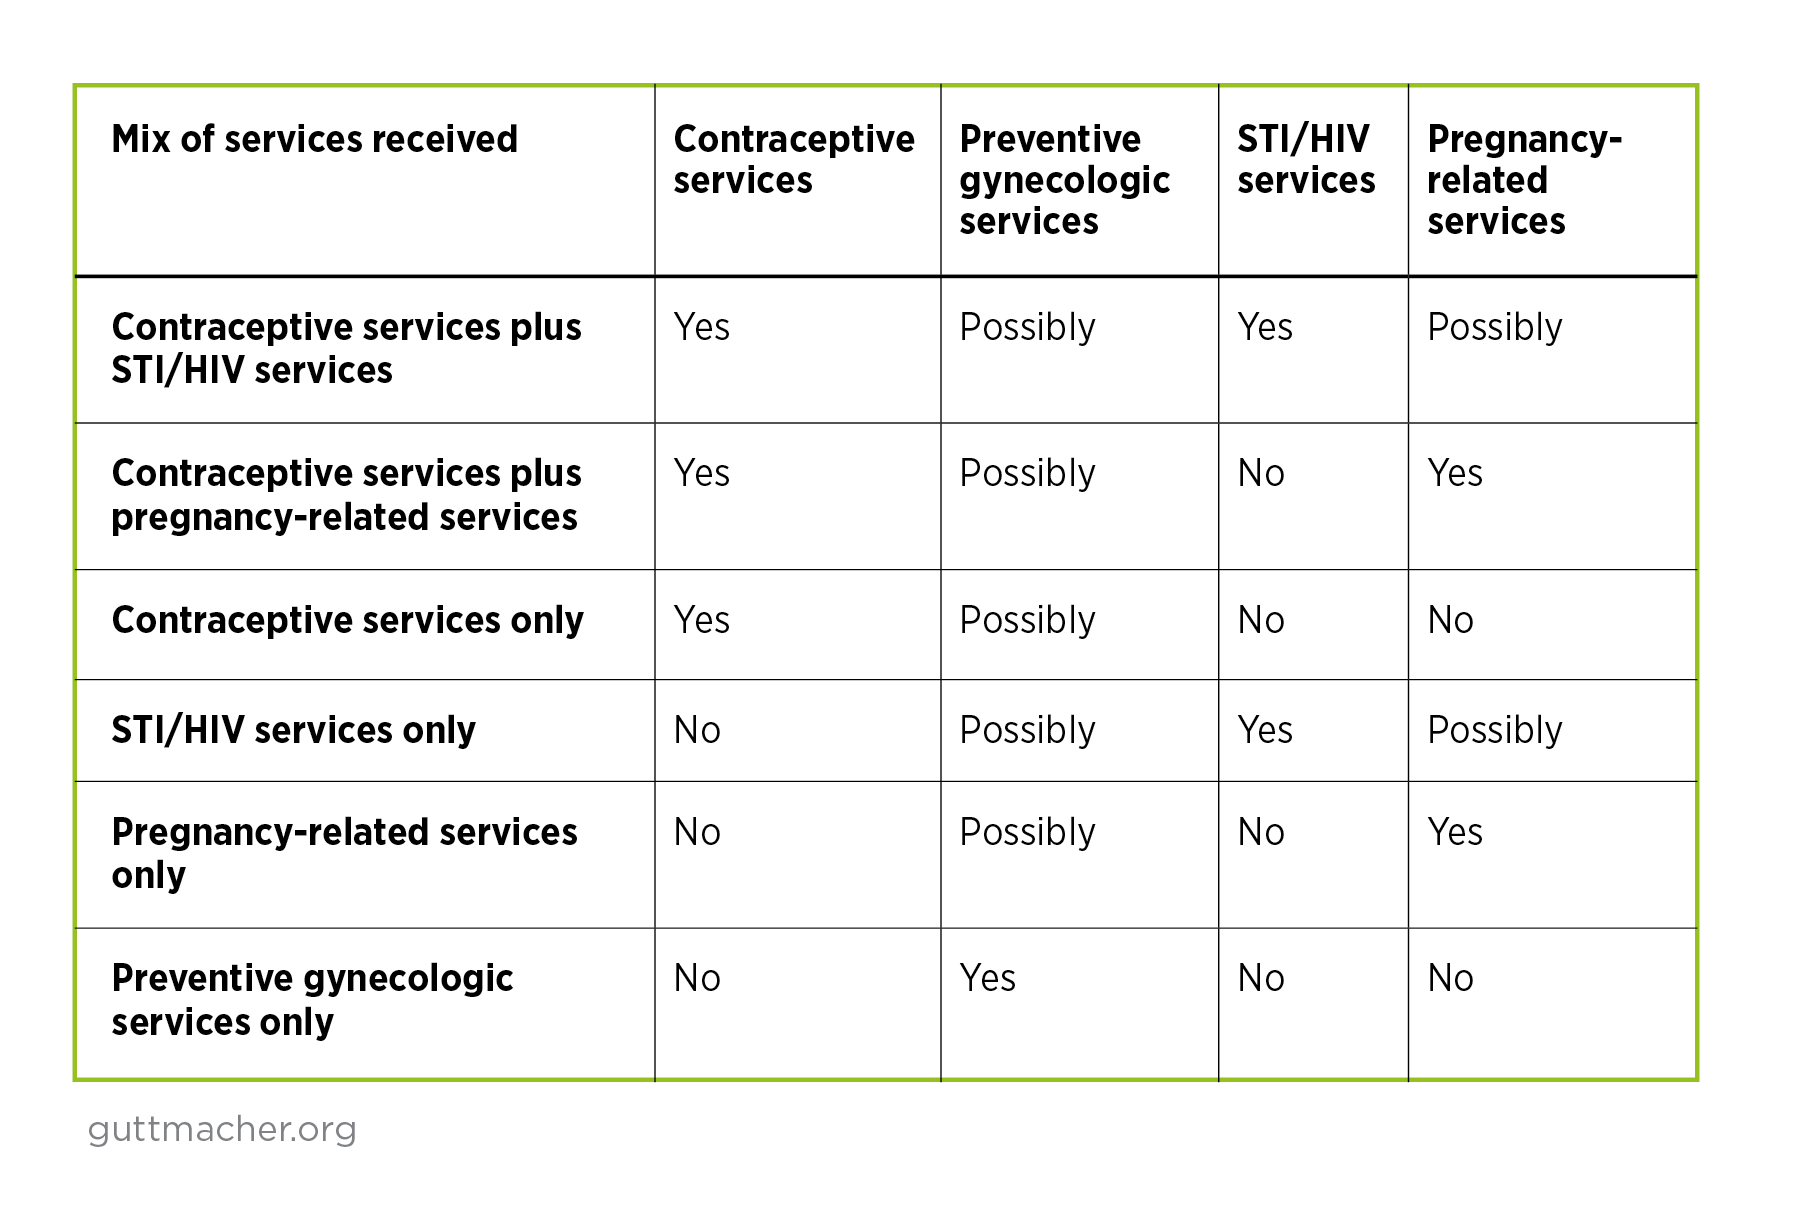
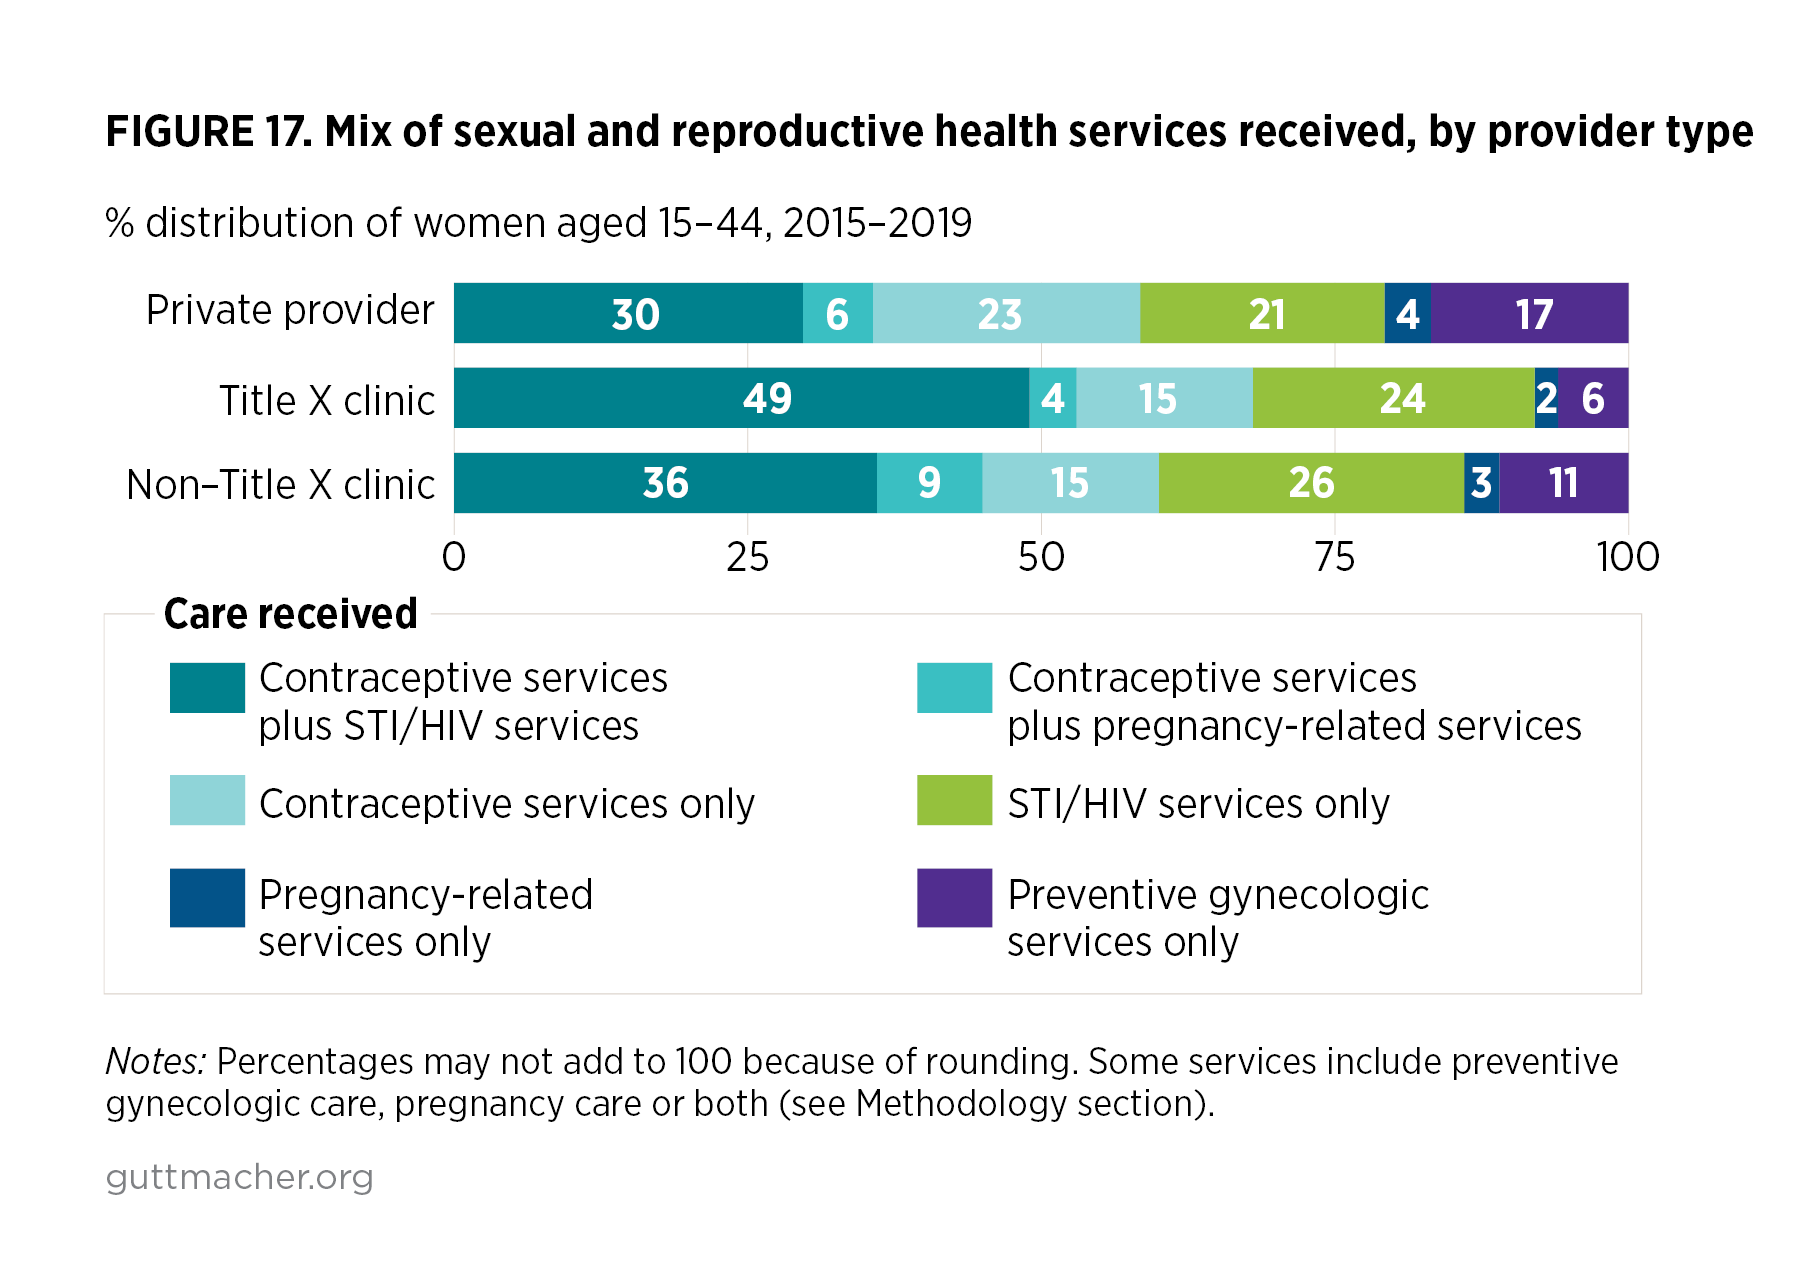
  • Among those relying on both private providers and public clinics, the proportion of women who reported receiving a combination of contraceptive and STI/HIV care increased between 2006–2010 and 2015–2019.
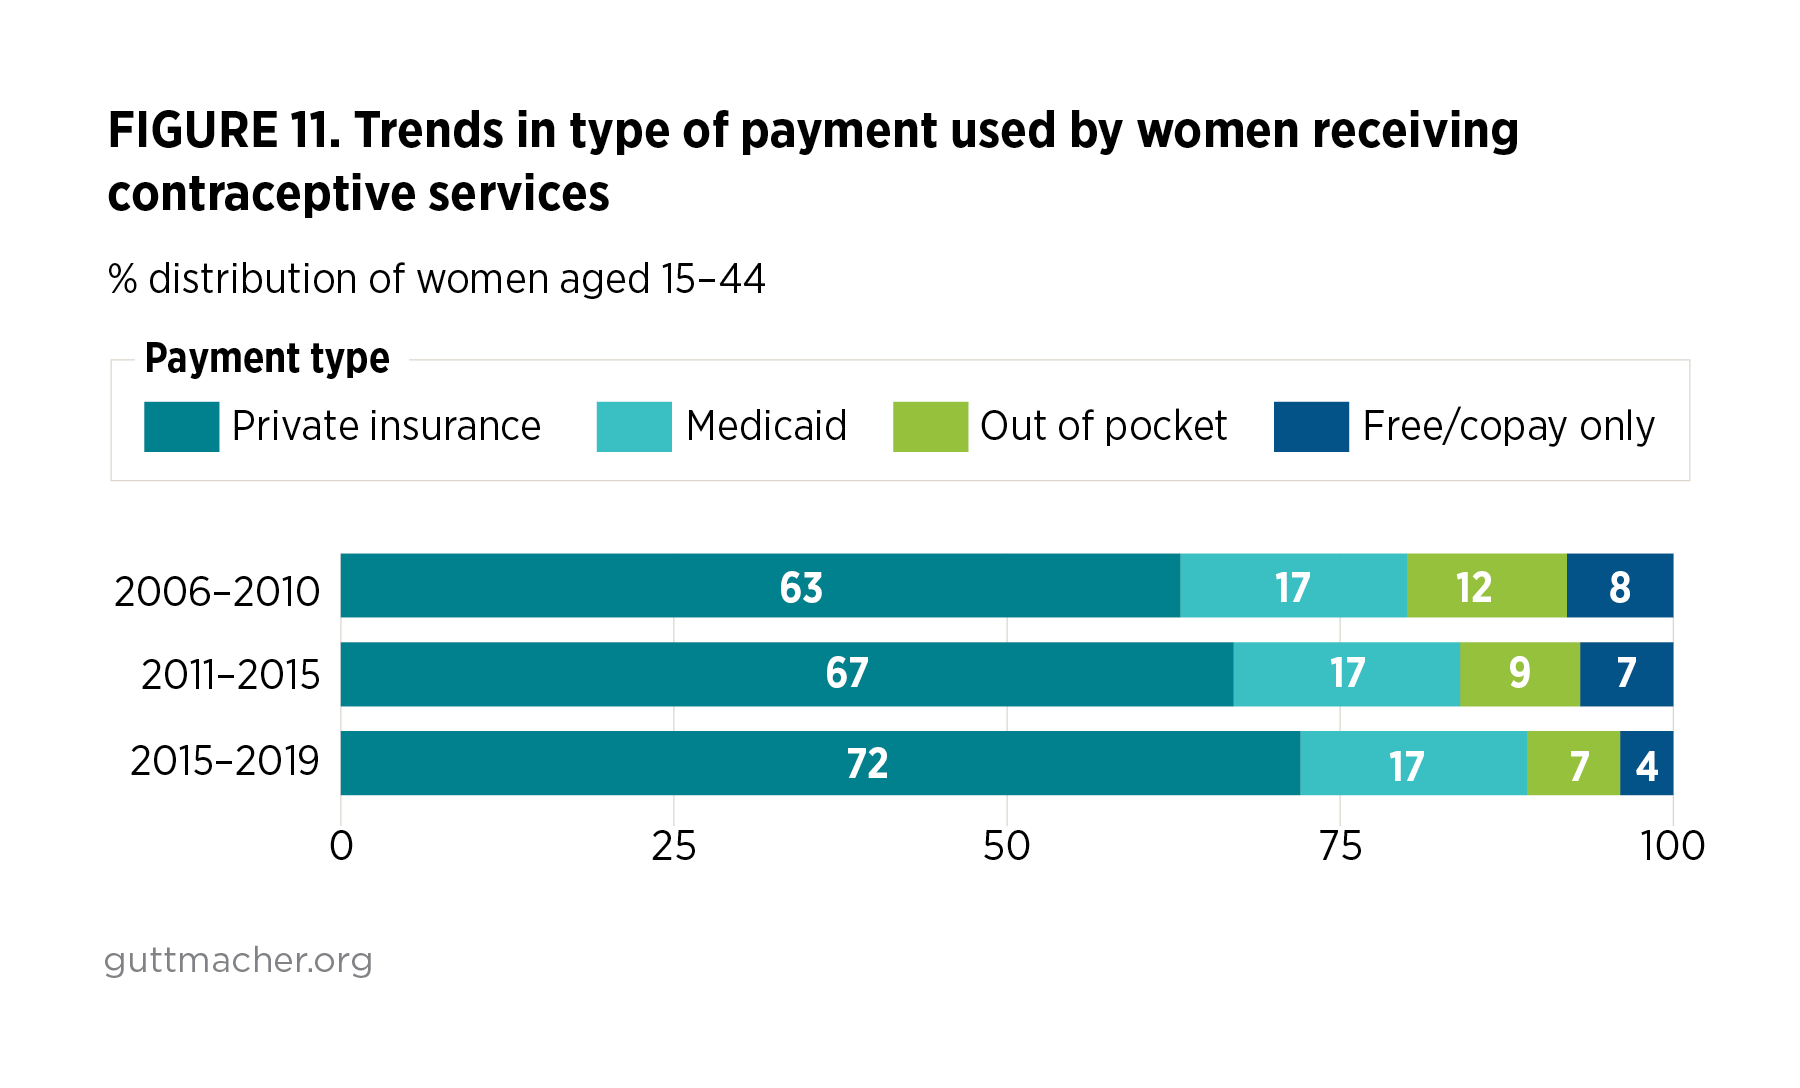
  • Implementation of the Affordable Care Act has likely contributed to some of the changes observed in where women receive contraceptive and other SRH services and how they pay for that care:
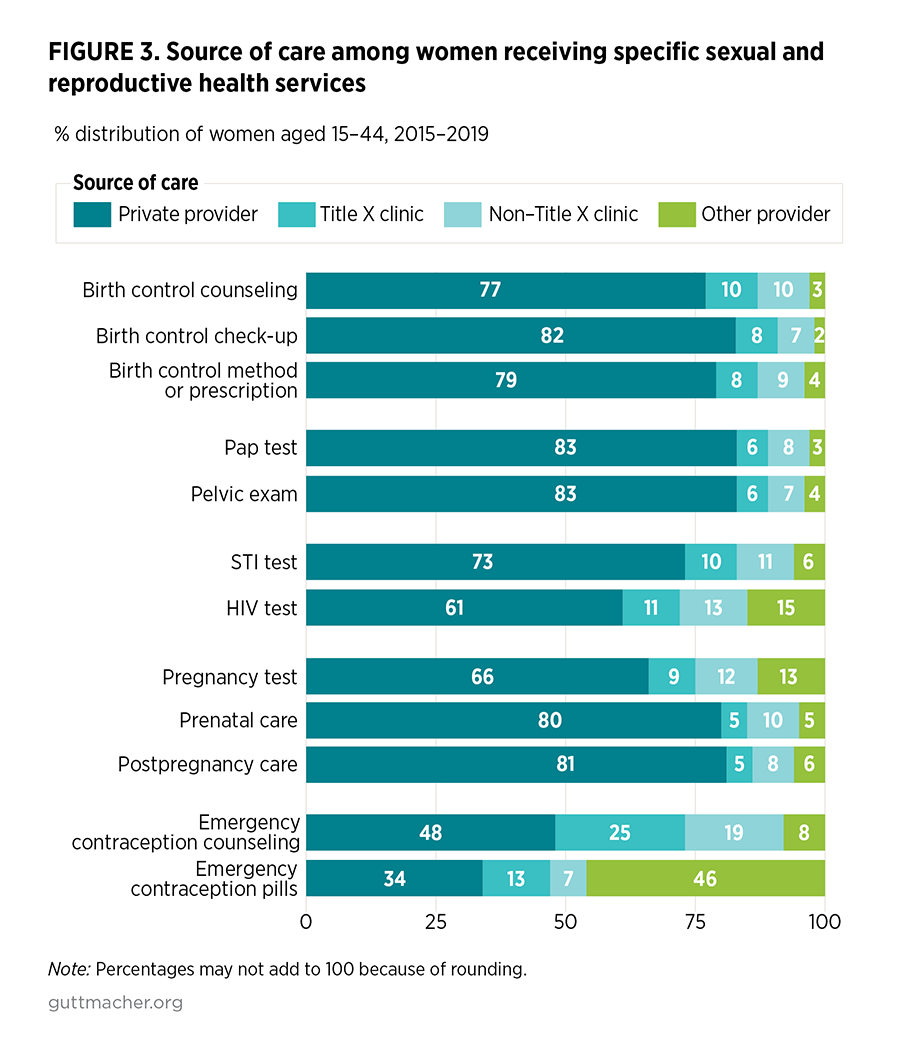
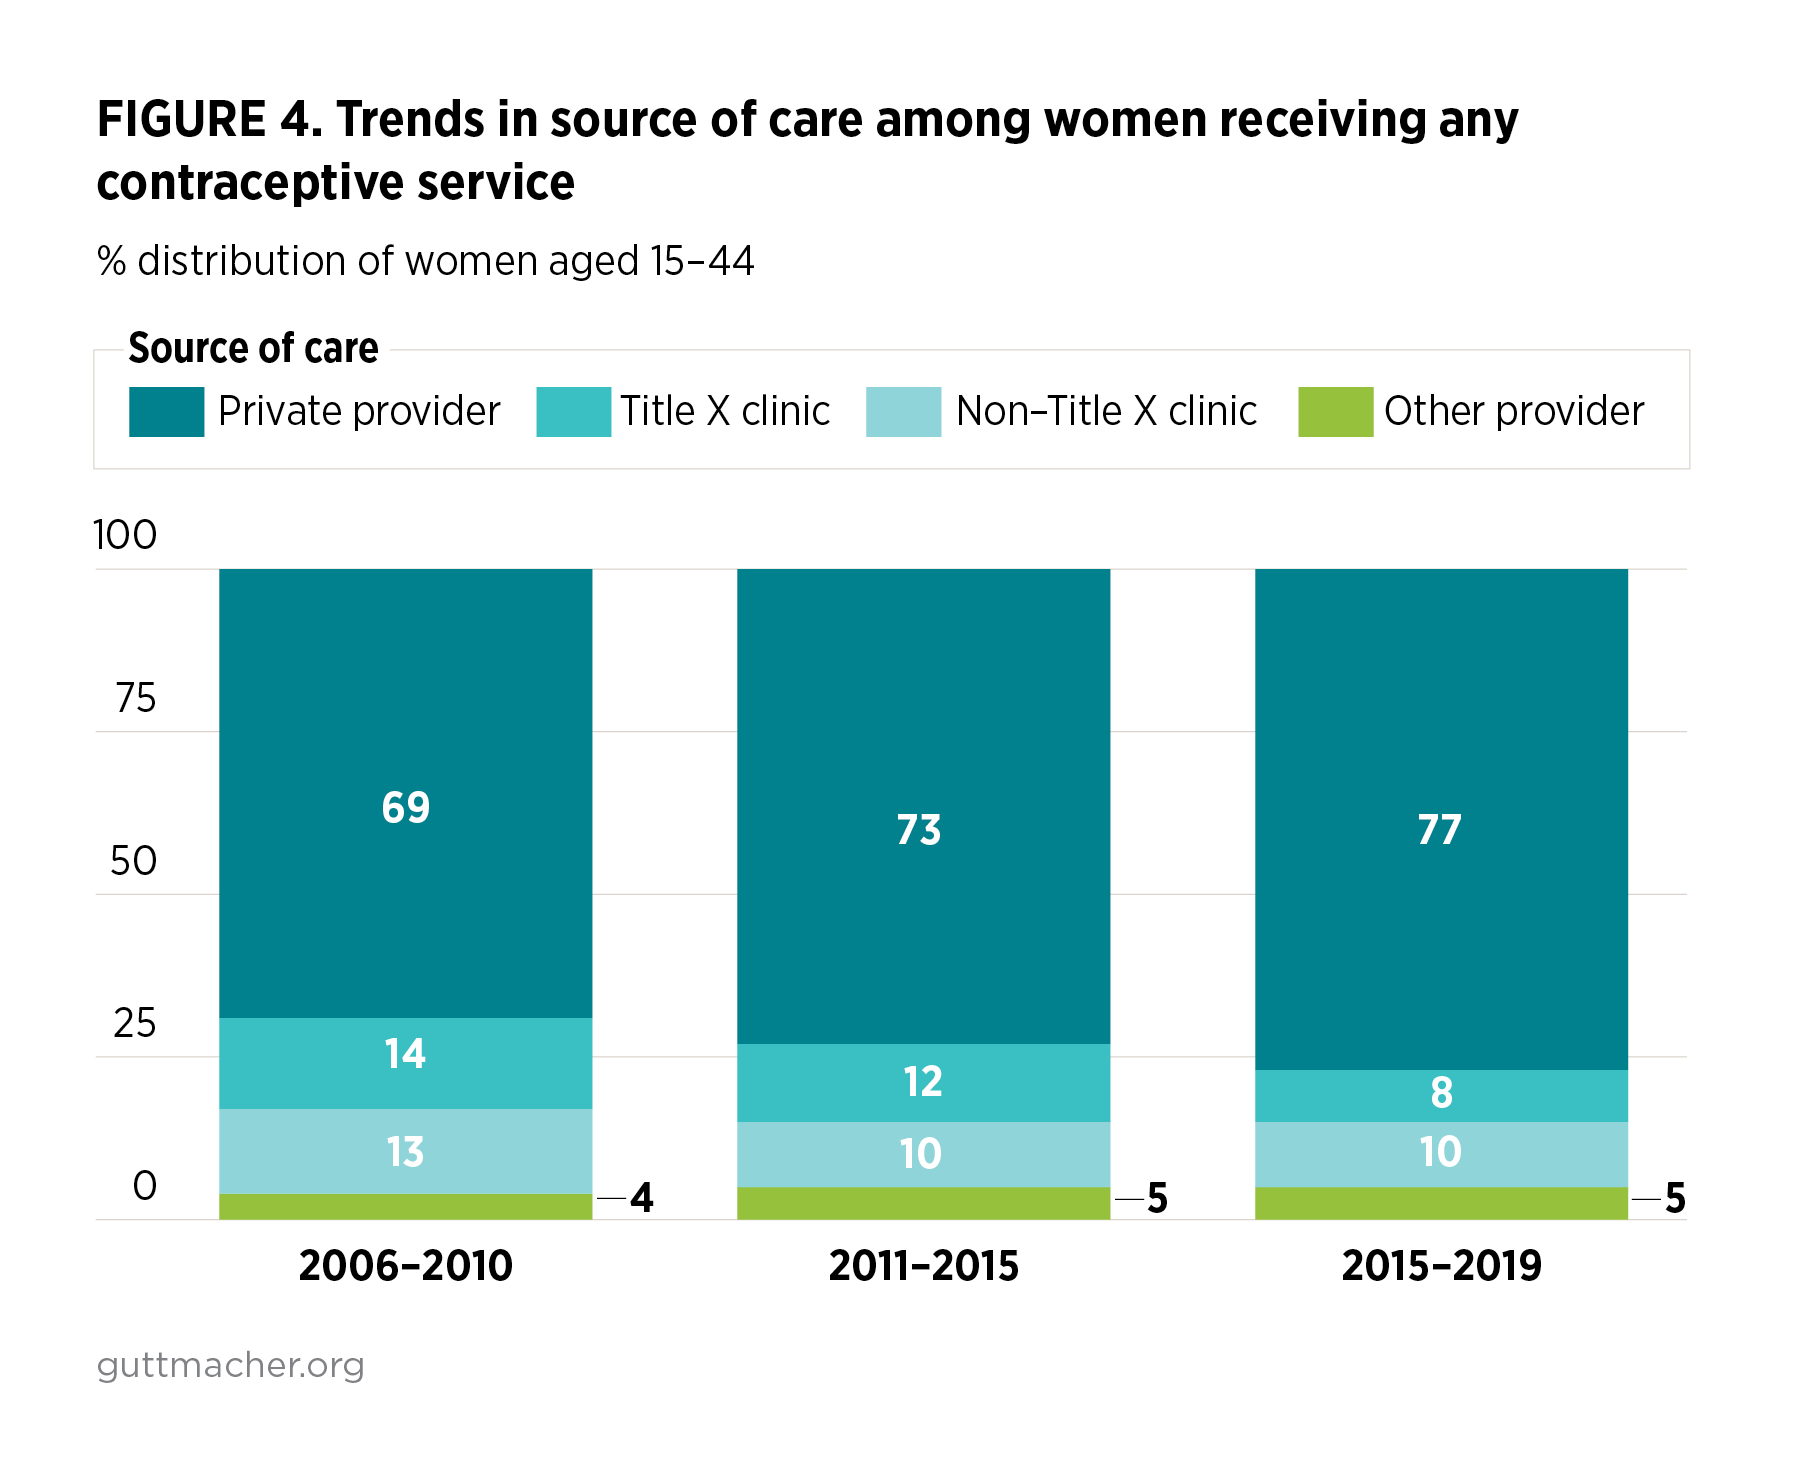
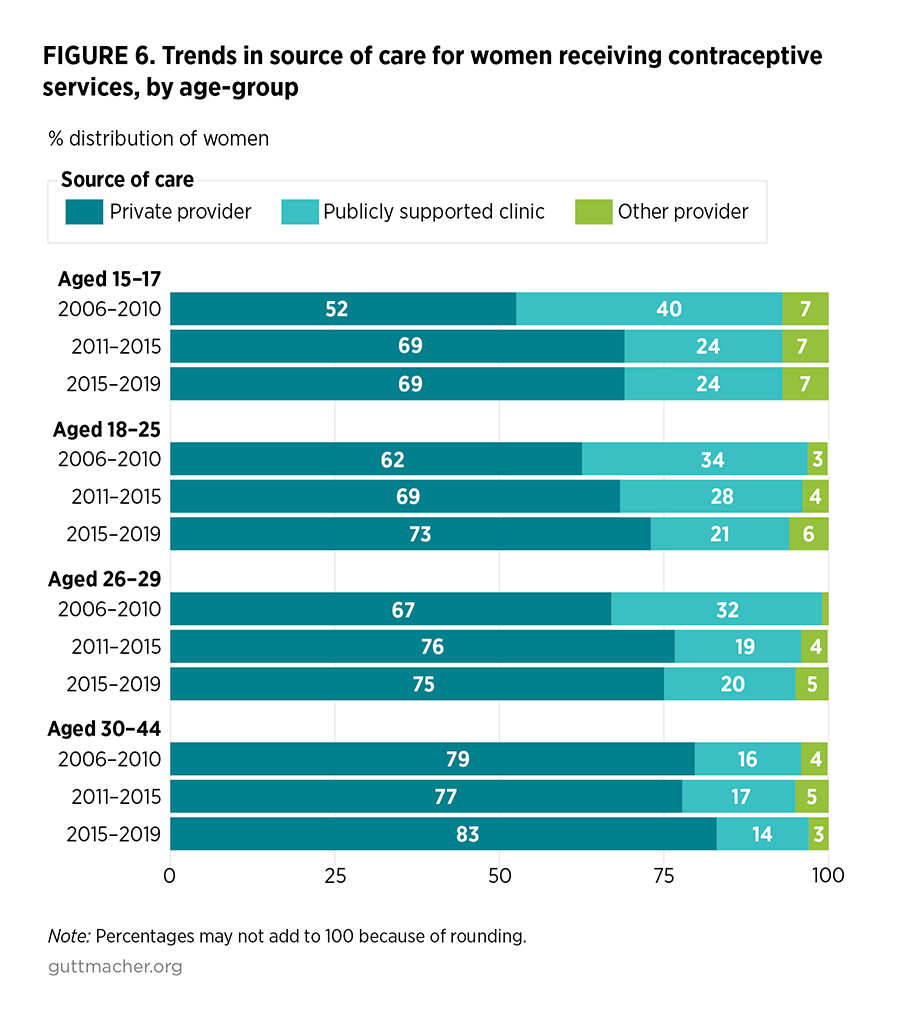
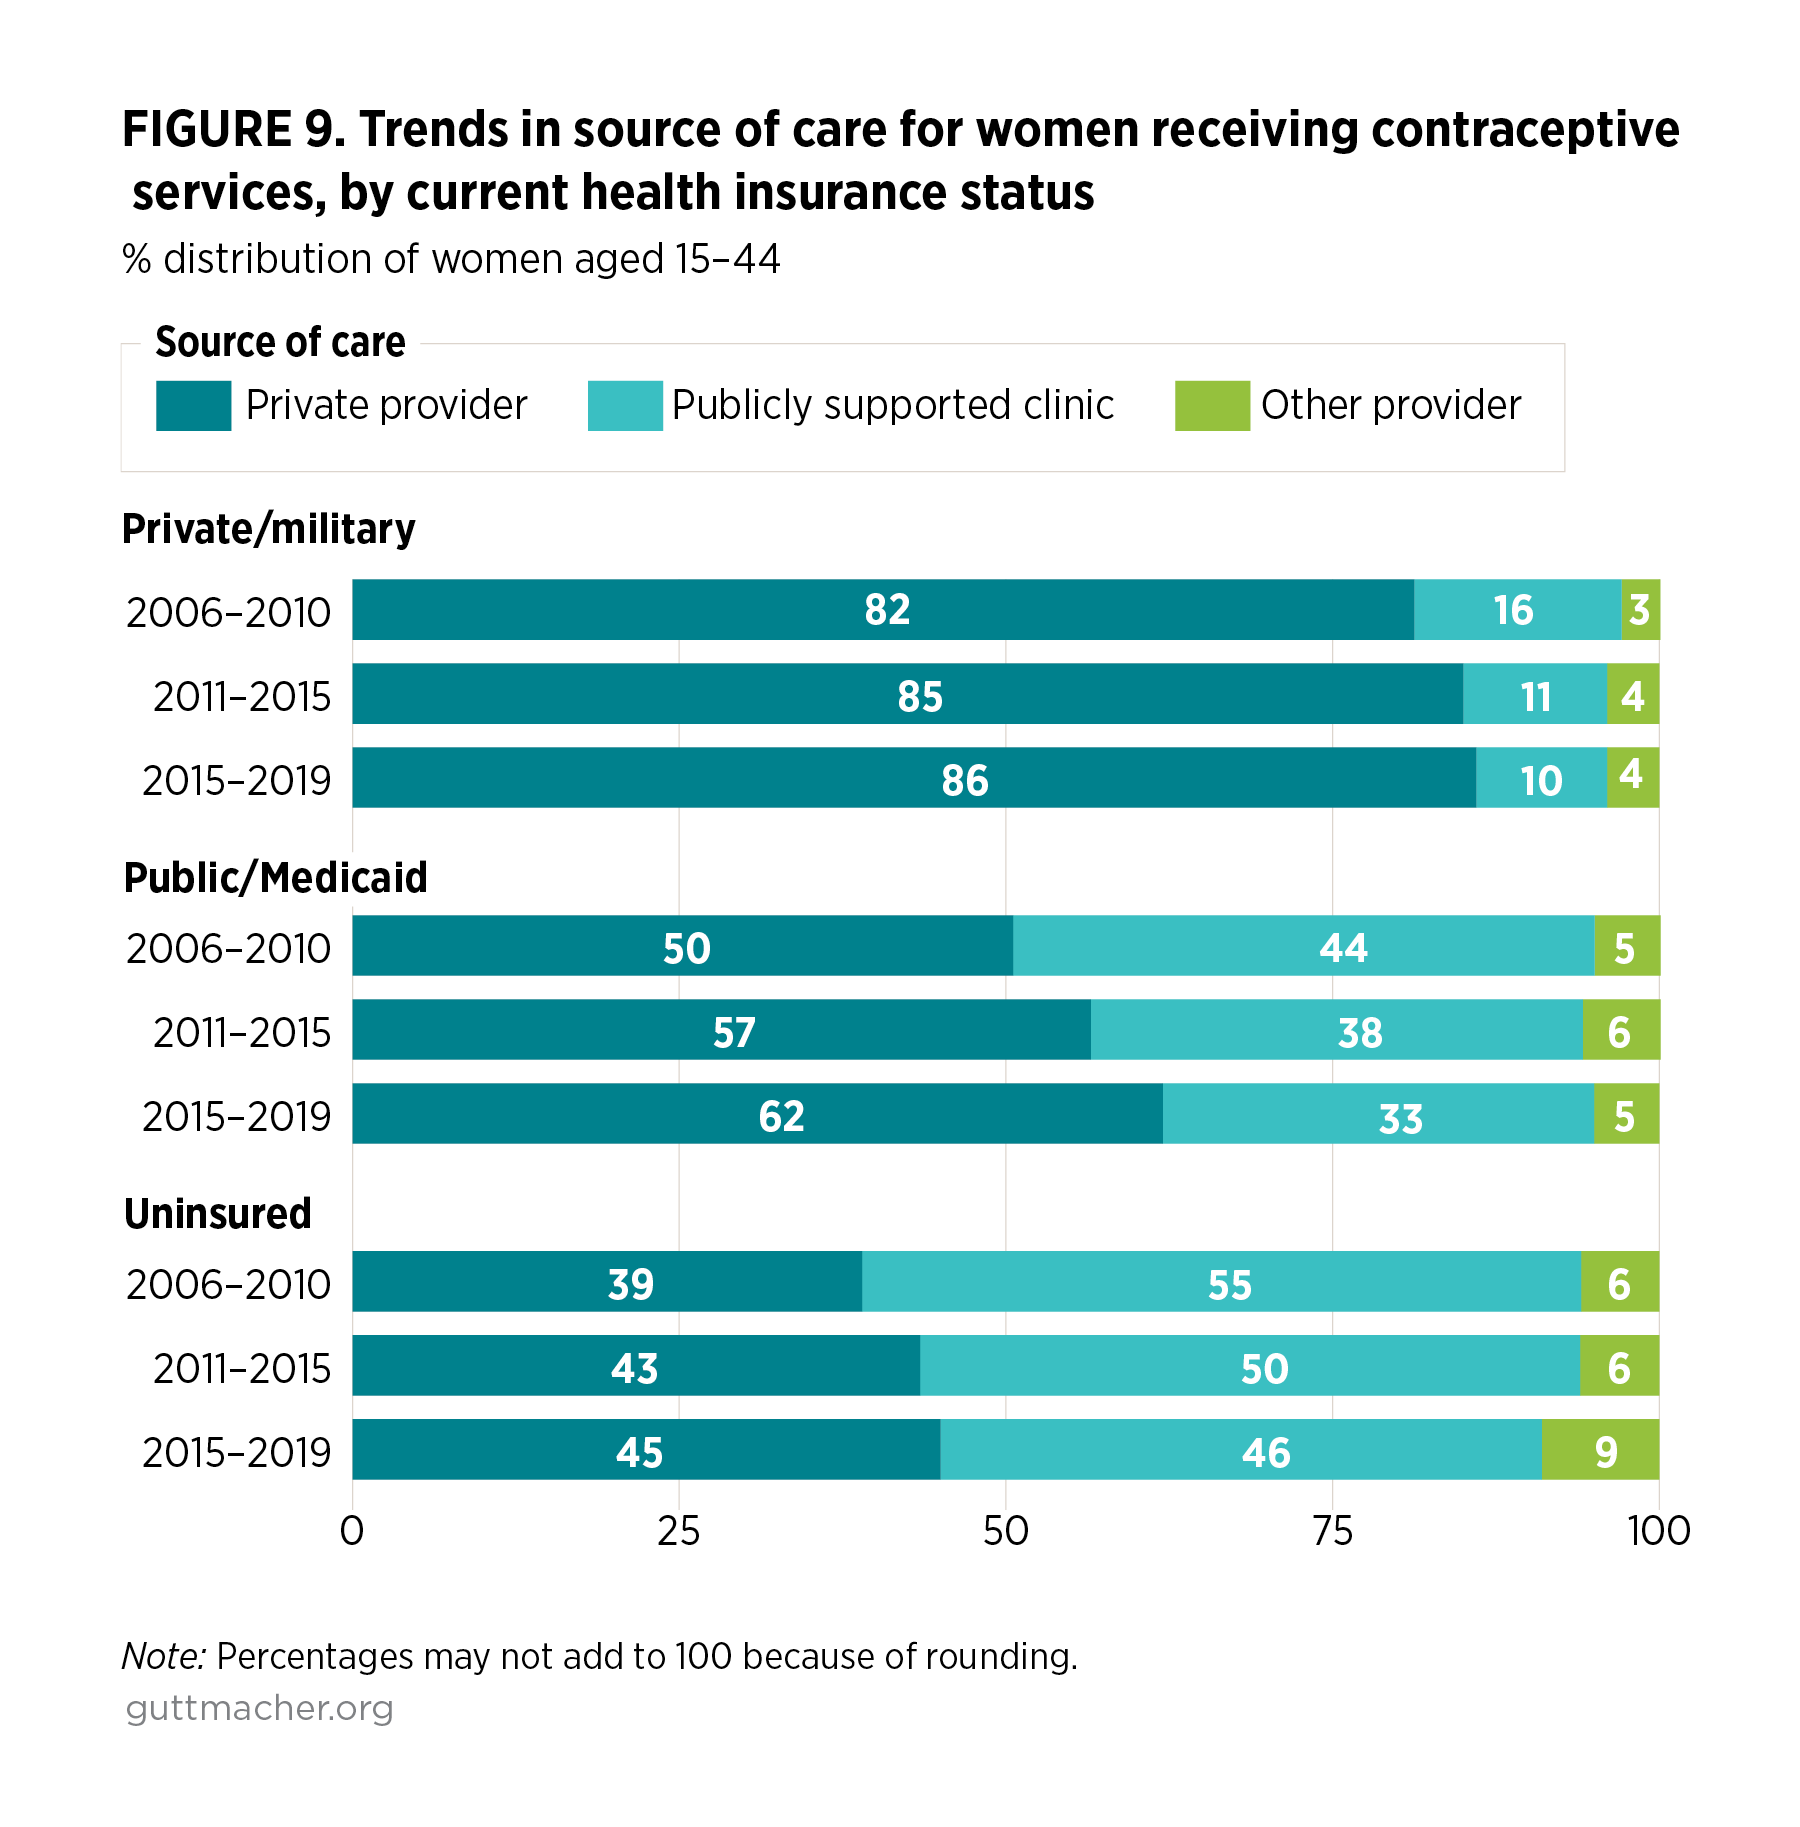
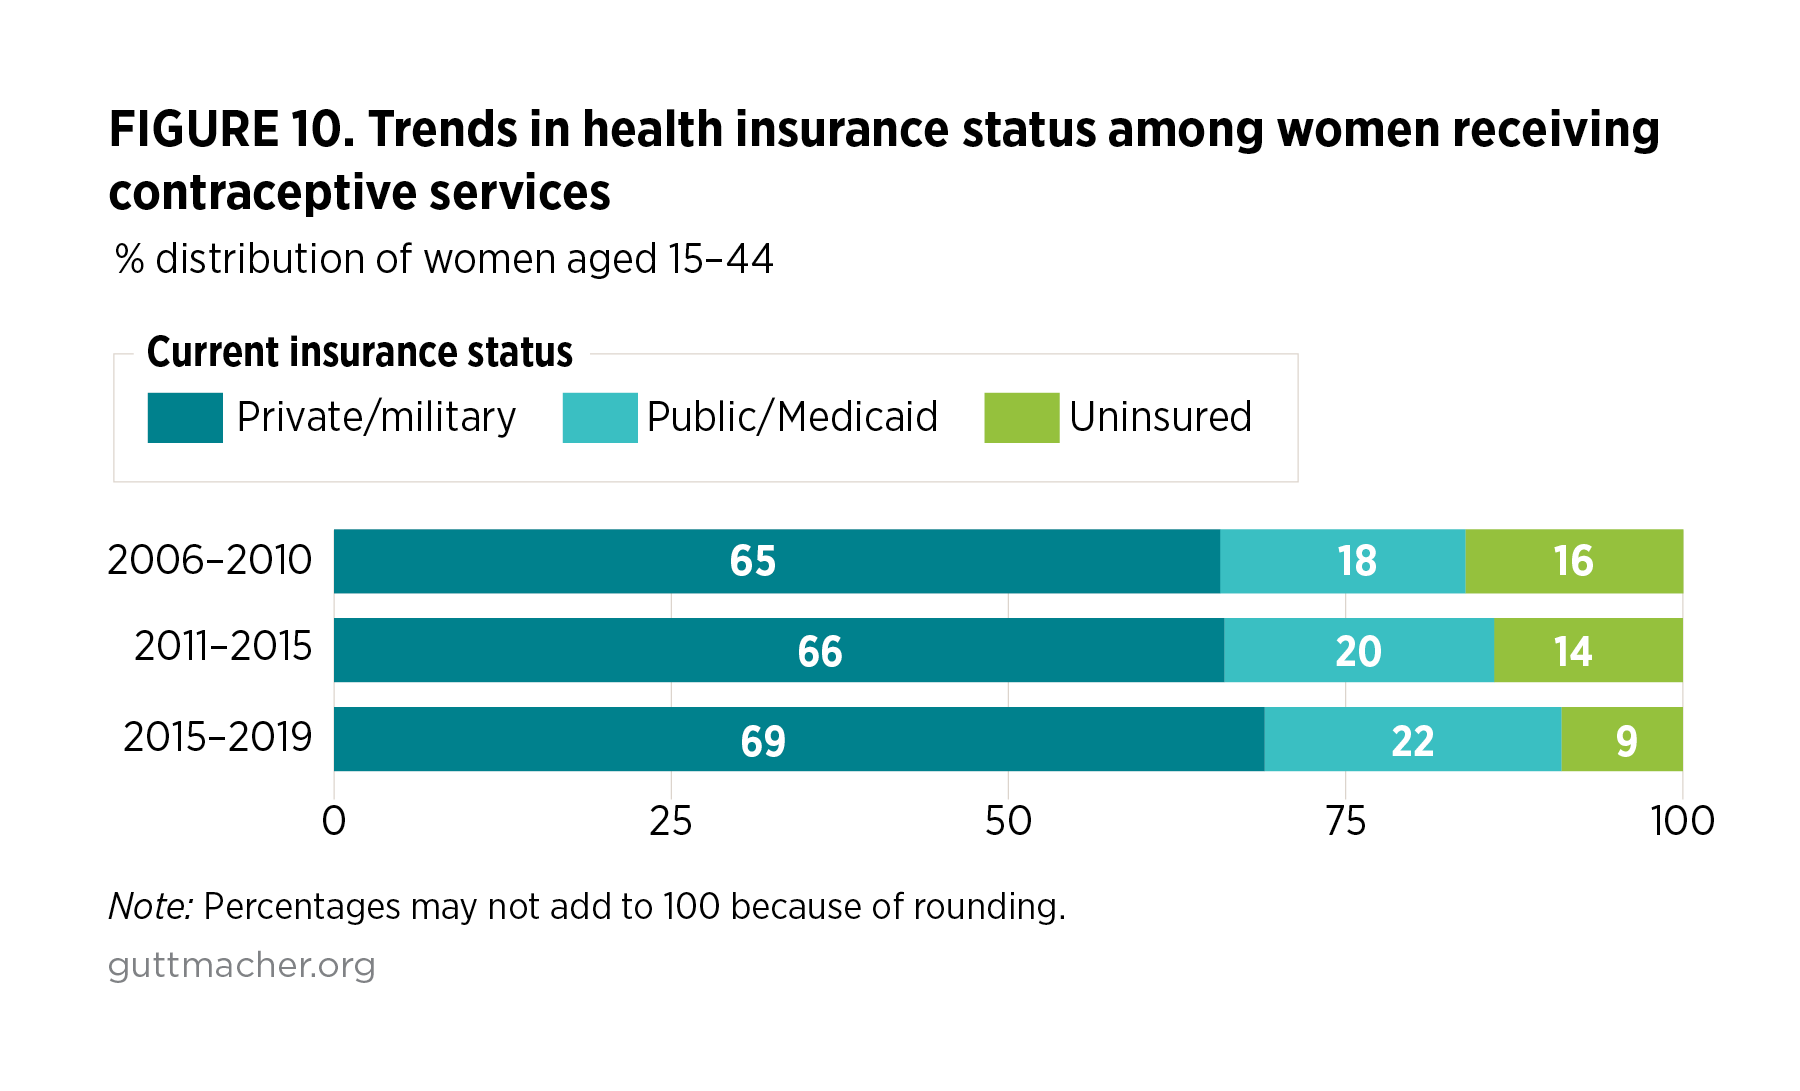
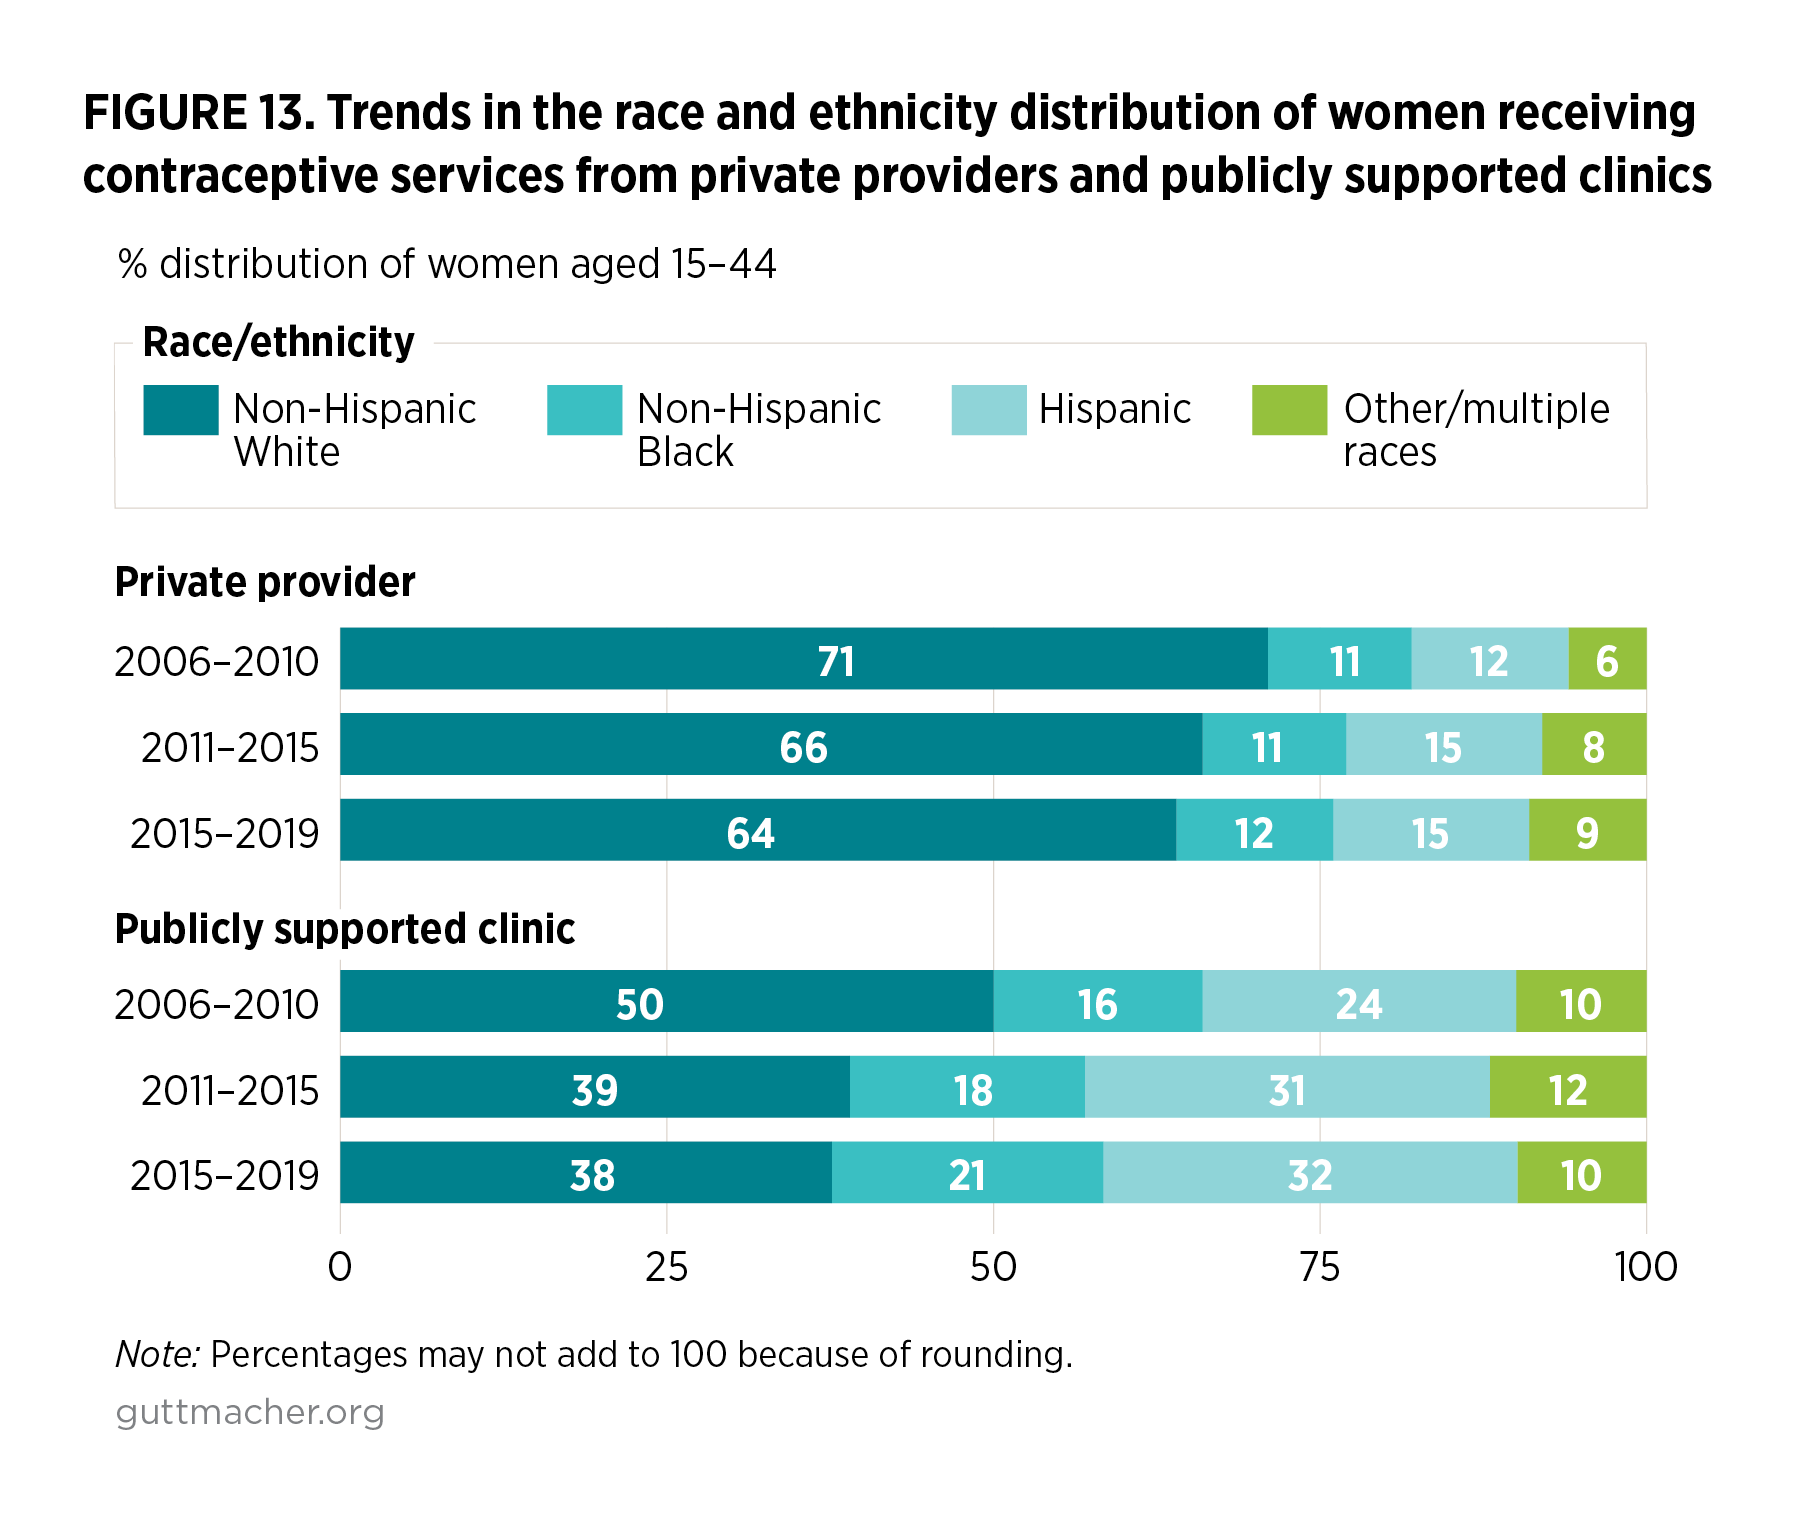
    • The share of women receiving contraceptive services who go to private providers rose from 69% to 77% between 2006–2010 and 2015–2019, in part because more women gained private or public health insurance coverage and there was a greater likelihood that their health insurance would cover SRH services.
    • There was a complementary drop in the share of women receiving contraceptive services who went to a publicly funded clinic, from 27% in 2006–2010 to 18% in 2015–2019.
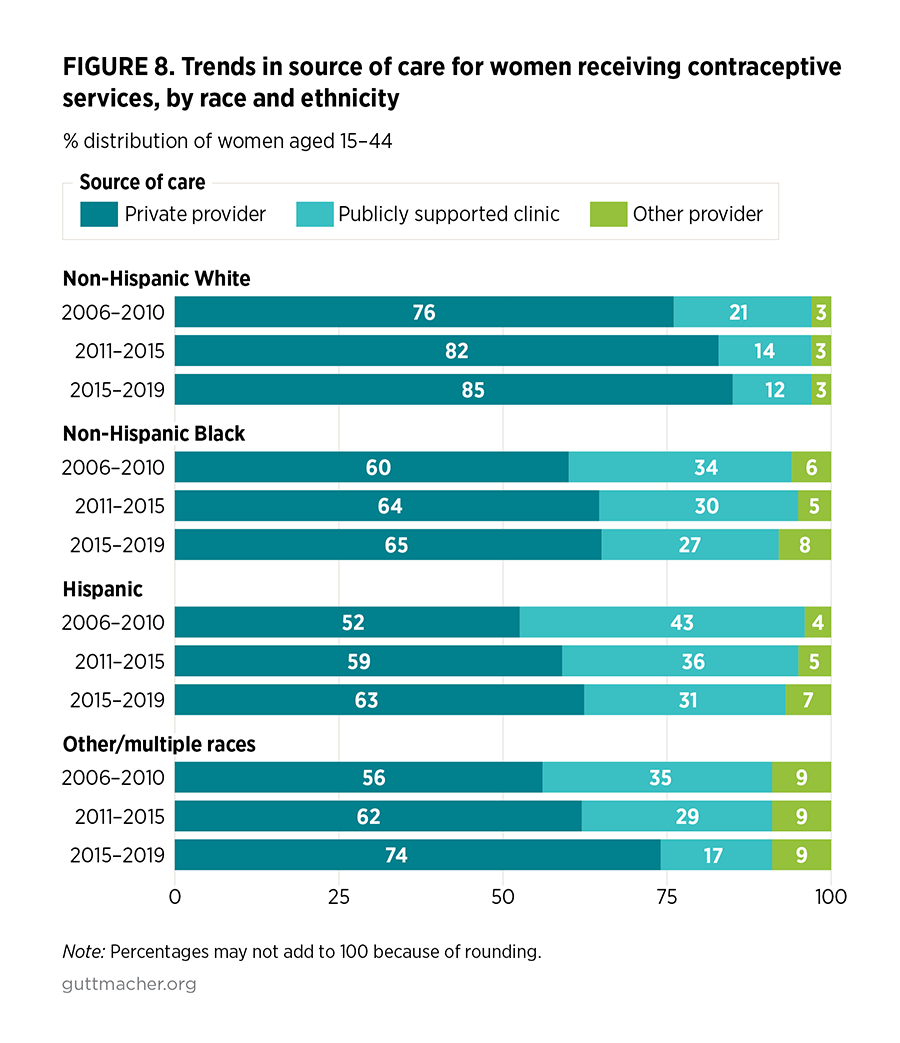
    • For non-Hispanic Black women, immigrant women and uninsured women, there was no increase in the use of private providers for contraceptive care from 2006–2010 to 2015–2019.
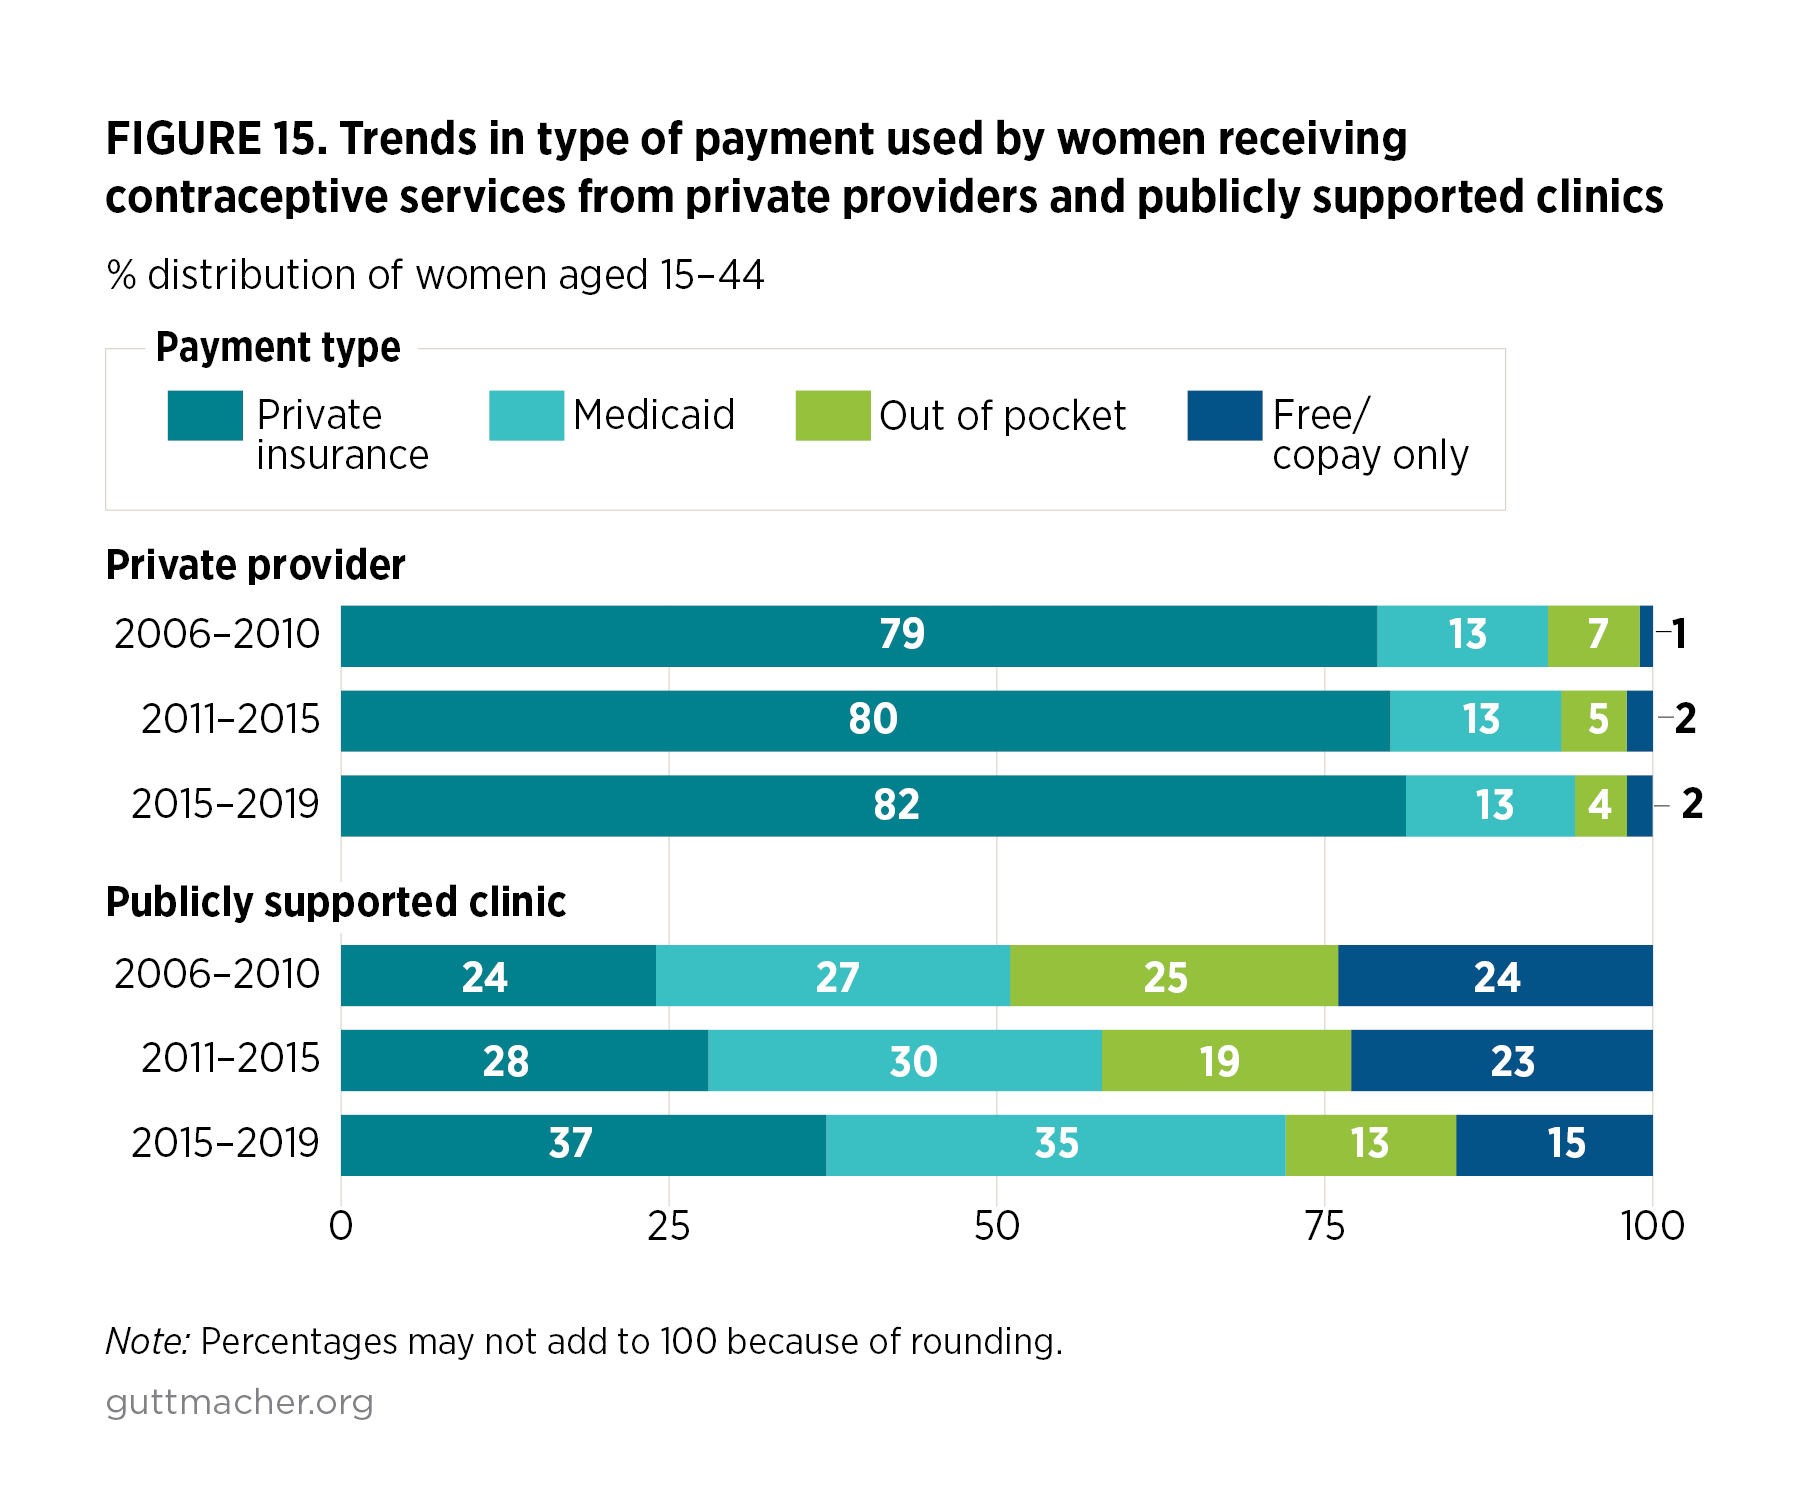
    • Among women served at publicly funded clinics between 2006–2010 and 2015–2019, there were significant increases in the use of both public and private insurance to pay for their care.

Background

Each year in the United States, some 44 million women—three out of every four women of reproductive age—receive one or more sexual or reproductive health (SRH) service from a medical provider. Approximately 25 million women receive a service related to obtaining or continuing a contraceptive method.1 Women rely on private and public health care providers for these services, including both private practice doctors and more than 10,000 publicly funded clinics.2 Many critical preventive care services are provided within the context of these SRH visits. The Centers for Disease Control and Prevention (CDC) has done a comprehensive review of the evidence around provision of quality family planning services and recommends a core set of preventive services that providers should offer to help patients avoid negative health outcomes and achieve desired outcomes.3 The National Academy of Medicine (formerly the Institute of Medicine) has identified a number of specific SRH services and screenings that support women’s overall health and should be provided by health insurance plans without cost sharing by patients.4 Understanding trends and patterns around women’s use of SRH services—including what services they receive, where they go for care, how they pay for care, and how use and care vary according to women’s and providers’ characteristics—is critical for program planners and policymakers who aim to improve both access to care and the health of women and families. In addition, identifying gaps in the services provided or in the care received by subgroups of the population are important steps necessary for designing programs and service delivery options that will best meet the SRH care needs of women.*

Over the past two decades, a number of policy and programmatic changes have been implemented with the potential to affect the delivery and use of SRH care for millions of women in the United States. Beginning in the mid-1990s, contraceptive coverage guarantees were enacted by many states, and these improved the accessibility of contraceptive services and increased their use among women with private insurance.5,6 At the same time, many states also implemented and approved Medicaid family planning expansions, which allowed more low-income women who were not eligible for full-benefit Medicaid to enroll in Medicaid specifically for coverage of family planning care.7

Since 2010, policies implemented as part of the Affordable Care Act (ACA)8 have further improved access to contraceptive and other reproductive health care services in a number of ways: by covering young adults on their parents’ insurance policy until age 26 (effective as of September 2010), requiring preventive care (including contraceptive and other reproductive health services) to be provided with no cost sharing (effective as of January 2013),9 and expanding access to health care coverage through Medicaid or the health care marketplaces (effective as of January 2014). In addition, changes in the clinical recommendations around cervical cancer screening no longer suggest that most women receive an annual screening and now recommend screening every three years or longer, depending on the screening test used.10

Unfortunately, many of the gains made over the last two decades in terms of improved health care coverage and access to SRH services have stagnated or been lost because of Trump administration policies aimed at both the ACA generally and at the provision of SRH care services specifically. For example, the proportion of women of reproductive age who were uninsured fell from 20% in 2013 to 12% in 2016, but then remained unchanged through 2018, at 12%.11 Moreover, the nationwide capacity of family planning clinics funded by the federal Title X program to provide care to low-income patients fell by nearly 50% between 2018 and 2019 because of the Trump administration’s "domestic gag rule."12 The gag rule prohibits clinics that receive Title X funding from offering abortion referrals and requires strict separation of finances and physical space for funded and nonfunded activities.

This report looks in detail at the use of SRH services by women in the United States during the period 2006–2019, prior to the most recent attacks on women’s health care and especially on the network of providers offering publicly supported family planning services. This report serves as an update to earlier reports that were based on 1995–2010 data from the National Survey of Family Growth (NSFG).1,13–15 The NSFG is the only national data source that collects detailed information about the receipt of a range of specific SRH services and includes data on provider type and type of insurance or payment. The NSFG collects data using a continuous methodology; data are released every two years, allowing for trend analyses. Prior research using data from the 1995, 2002 and 2006–2010 NSFG found that the range and type of SRH services received by women visiting publicly funded clinics differed from those received by women visiting private doctors. Some, but not all, of these differences could be attributed to differences in the characteristics of women using each type of provider—with young, unmarried, less educated and low-income women and women of color most likely to depend on public providers for their care. A more recent study, which focused on young adults and compared 2002, 2006–2010 and 2013–201516 NSFG data, found an increase over time in the proportion of women, especially younger women, who obtained care from private providers and a decrease in the proportion served by publicly supported clinics. At the same time, more women reported paying for their care with private insurance in the later period. The current study adds data from the two most recent NSFG data collection periods (2015–2017 and 2017–2019), covers all women of reproductive age (15–44) and provides extensive detail on service use by women’s characteristics and by the type of provider visited.

Specifically, this analysis uses NSFG female survey data for 2006–2010, 2011–2015 and 2015–2019 to update many of the analyses published in earlier reports and to examine patterns and trends in SRH service use for women according to age-group, income level, race and ethnicity, nativity and health insurance status, and according to the specific provider types visited by women receiving services in the prior year. The NSFG is the only national data source that identifies women who have received care from Title X–funded clinics and collects data on specific services received, allowing for comparisons in service delivery patterns among these clinics, other clinics and private providers. This focus is important because Title X–funded clinics are often the only source of SRH care for poor and low-income women. In addition, Title X provides the only federal funding dedicated solely to family planning; the program requires its grantees to adhere to regulations and guidelines that set a high standard of care and directs both how and what SRH services should be provided. The report also examines differences in service provision among publicly funded clinics according to their type, distinguishing between community health clinics (which include federally qualified health centers, or FQHCs), independent family planning clinics and public health department clinics. Finally, we also updated earlier analyses looking at whether women who receive family planning services from clinics report that the clinic is their usual source for medical care.1,13,14 By assessing trends in the mix of SRH services received from different types of providers, we expect these findings to inform the work of policymakers and program planners when developing recommendations for improving the delivery and financing of SRH services in the United States.

We are particularly interested in examining whether and how policies that expanded access to health coverage for SRH care have affected where women go to obtain services and how they pay for the care they receive. We consider the effects of policies that expanded access to coverage either specifically (through contraceptive coverage guarantees or family planning Medicaid expansions) or more generally (by improving access to public or private health insurance under the ACA). Data from the 2006–2010 NSFG are prior to implementation of the ACA, while data from the 2011–2015 NSFG encompass early implementation of ACA provisions and data from the 2015–2019 NSFG measure full implementation of the ACA. Questions to be answered from these data include:

  • Over these three time periods, has there been an increase in the proportion of women obtaining SRH care who are covered by public or private health insurance?
  • Were women more likely to use insurance to pay for their care in the most recent time period after the ACA was fully in effect?
  • Has the shift away from publicly funded clinics and toward greater use of private providers for SRH services observed in 2006–2010 and 2011–2015 continued into 2015–2019?
  • If so, has it been experienced evenly among all groups of women?
  • Are there continuing disparities according to income level or race and ethnicity in women’s use of SRH services and in where they go or how they pay for care?
  • Among women obtaining care from publicly funded clinics, what trends were observed by the type of clinic visited for care?

Methodology

Data sources

This study is based on data from the three most recent releases of the National Survey of Family Growth (NSFG)—those conducted in 2006–2010, 2011–2015 and 2015–2019.17–21 These nationally representative, in-home, cross-sectional surveys collect retrospective data from women aged 15–44 (15–49 in 2015–2019) and are conducted by the National Center for Health Statistics (NCHS). For consistency across all three survey periods, this analysis included only women aged 15–44. In 2015–2019, the sample size was 11,695 female respondents and the response rate was 66% (10,299 respondents were aged 15–44); in 2011–2015, the sample size was 11,300 and the response rate was 72%; and in 2006–2010, the sample size was 12,279 and the response rate was 78%. The NSFG provides sampling weights to make each period nationally representative.

Key measures

We included several key measures related to the use of sexual and reproductive health (SRH) services by women in the United States.

  • Receipt of services measures whether women reported receiving any of 15 specific SRH services in the prior year. In addition, four summary variables measure receipt of any contraceptive service, any preventive gynecologic service (Pap test or pelvic exam), any STI/HIV service and any pregnancy-related service (pregnancy test, prenatal or postpregnancy care, abortion).
  • Mix of services measures the combinations of types of SRH services received by women each year, classified into six service mix groups; for example, contraceptive services plus different types of other services versus different types of services without contraceptive care.
  • Source of care measures the type of provider visited for each individual SRH service received, classified as private provider, publicly supported clinic or other. Clinics are further divided according to whether they receive federal Title X funding and according to their type (community clinic, family planning clinic, public health department clinic, and hospital outpatient or school-based clinic). Other providers include employer or company clinics, hospital inpatient services, emergency rooms, urgent care centers and other (nonspecified) providers.
  • Usual source for medical care measures whether women who visited publicly supported clinics reported that the clinic visited was their usual source for medical care.
  • Payment type measures the self-reported means by which women paid for their medical visit for SRH care services (private health insurance, Medicaid/public health insurance, out-of-pocket/self-pay, copayment only, no payment).
  • Women’s characteristics measure a variety of demographic and socioeconomic variables. The items used in these analyses include age-group (15–17, 18–25, 26–29, 30–44); race and ethnicity (non-Hispanic White, non-Hispanic Black, Hispanic, other/multiple races); nativity (U.S. born, foreign born); family income as a percentage of the federal poverty level (less than 100%, 100–249%, equal to or more than 250%); and health insurance status (currently has private or military insurance, currently has Medicaid or other public insurance, currently has no insurance).

Receipt of services

Respondents to the female NSFG questionnaire are asked whether they received any of 15 specific contraceptive and related reproductive health care services from a doctor or other medical care provider in the prior 12 months.

Data are presented on each service separately, and several summary measures examine women’s receipt of any contraceptive method or reproductive health care services, both together and for subgroups of services. We created additional summary measures for receipt of any contraceptive service, any preventive gynecologic service, any STI/HIV service and any pregnancy-related service.

Receipt of any contraceptive service includes having received at least one of seven contraceptive service items asked about (counseling or information about birth control, check-up or medical test related to using a birth control method, method of birth control or a prescription for a method, counseling or information about getting sterilized, a sterilizing operation, counseling or information about emergency contraception, emergency contraception or a prescription for it). Receipt of any preventive gynecologic service includes having received a Pap test or pelvic exam. Receipt of any STI/HIV service includes having received counseling, testing or treatment for an STI or having received an HIV test. Questionnaire wording for the STI service variable changed over the periods examined here: In 2006–2010 and 2011–2013, women were asked a single question about receipt of counseling, testing or treatment for an STI; in 2013–2015 and 2015–2019, women were simply asked if they had received testing for an STI. Receipt of pregnancy-related care includes having received a pregnancy test, prenatal care, postpregnancy care or an abortion. (Although all survey measures have issues related to self-reporting errors, it is well established that abortion in particular is not fully reported in the NSFG.22 Therefore, although abortion is included in the summary measures of any SRH service and any pregnancy-related service, we present it separately only in Table 1).

Mix of services

We combined the information on the specific SRH services that each woman reported receiving to classify women according to the mix of services received during the prior year using the following six categories: (1) contraceptive services with STI/HIV services (with or without preventive gynecologic or pregnancy-related services); (2) contraceptive services with pregnancy-related services (with or without preventive gynecologic services); (3) contraceptive services only (with or without preventive gynecologic services); (4) STI/HIV services without contraceptive services (with or without preventive gynecologic services or pregnancy-related services); (5) pregnancy-related services without contraceptive services (with or without preventive gynecologic services); and (6) preventive gynecologic services only.


Source of care

For each SRH service received, women were asked a series of questions about the type of provider visited to obtain that service and the method of payment used. Respondents were shown a card with 11 provider types to choose from: private doctor’s office, health maintenance organization facility, four types of potentially publicly supported clinics (community or public health clinic, family planning or Planned Parenthood clinic, school-based clinic, hospital outpatient clinic), employer or company clinic, hospital emergency room, hospital regular room, urgent care center and some other place.

Women reporting services from any of the four clinic types were asked for a specific provider name and address that was then compared with a national database of family planning clinics. This database is updated regularly and contains all known publicly supported clinics providing contraceptive services; each clinic is classified according to its type and whether it receives federal Title X program funding. Information on Title X funding status and whether the clinic was a public health department site was then attached to each respondent’s record for all clinics found in the database. Clinics reported by women that could not be found in the database were coded as being unknown, and the name and address were manually entered if women could provide that information. Cases of unknown clinics that were not identified from the clinic database were flagged in the public use data file as either logical or multiple regression imputations. Logical imputations were based on both NCHS staff and Guttmacher staff reviewing the lists of unknown clinics and attempting to make definite or likely matches using the clinic database, online searches and site follow-up to confirm whether matched sites were publicly funded clinics or private providers (typically individual doctors or physician group practices). Cases where respondents could not provide any or adequate identifying information to make a logical imputation for clinic or provider type were resolved using multiple regression imputations done by NCHS staff using the same procedures as all other NSFG imputations.23

Based on the provider type and clinic questions, the primary source of care variable used in this analysis includes the following categories: 1) private provider, 2) publicly supported clinic (divided into Title X–funded clinics and clinics not funded by Title X) and 3) other (includes employer clinic, hospital emergency room or inpatient care, urgent care or some other place).

In addition, a second variable was created to classify clinics using the original four clinic categories reported by women, along with information on whether a clinic was a public health department site. This variable classifies all publicly supported clinics into four categories: 1) community clinics, 2) family planning clinics, 3) public health department clinics and 4) hospital outpatient and school-based clinics.

  • Community clinics likely include all or most FQHCs that women visited as well as other community clinics that do not receive FQHC funding, but provide a range of primary care services that include SRH care.
  • Family planning clinics include Planned Parenthood clinics as well as other freestanding publicly supported clinics that specialize in the provision of contraceptive services.
  • Public health department clinics often specialize in the provision of family planning services and/or STI services; many also provide immunizations and infectious disease services, typically separate from family planning care.
  • Hospital outpatient clinics and school-based clinics are typically split between those that focus on family planning care and those that provide a broader range of services.

In each year, a small proportion of women receiving any contraceptive service or any SRH care visited more than one provider type for their services in the past 12 months. In these cases, we assigned women to a single provider type using the following hierarchy of services and order of provider types. First, we coded the provider type visited for contraceptive services using the following order (if more than one type of provider was visited for contraceptive services): Title X–funded clinic, clinic not funded by Title X, private provider or health maintenance organization, hospital, other or employer clinic. If no contraceptive services were received, we coded the provider type visited for a Pap test or pelvic exam using the same order of providers. Finally, if no contraceptive services or Pap test or pelvic exam were received, we coded the provider type visited for STI/HIV services or pregnancy-related services, again using the same order of providers. For example, a woman who visited both a publicly supported clinic and a private provider for contraceptive services during the year would be coded as a clinic patient; a woman who received STI/HIV services from a clinic, but contraceptive services or an annual gynecologic visit from a private provider, would be coded as a private provider patient.

Usual source of care

For the subset of women visiting publicly supported clinics for contraceptive and related services, we examined information about whether respondents considered these clinics to be their usual source for medical care. All female respondents who reported visiting a clinic were asked: "Is this clinic your regular place for medical care, or do you usually go somewhere else for medical care?" Women were asked this question separately for each clinic that they reported visiting in the prior 12 months for any of the SRH services received. Response options were: clinic is regular place; clinic is regular place, but I go to more than one place regularly; usually go somewhere else; or don’t have a usual place for medical care.

For this analysis, we examined the proportion of women reporting that the clinic visited for contraceptive care was their only regular source of medical care (excluding those with more than one regular source of care). We defined contraceptive care broadly to include all contraceptive services, as well as standard preventive gynecologic services typically provided in a contraceptive visit. These services included birth control method/prescription; birth control check-up; birth control counseling; sterilization counseling; sterilization procedure; emergency contraception counseling; emergency contraception; Pap test; pelvic exam; pregnancy test; and STI counseling, testing or treatment. To keep the focus on women who reported that their source for contraceptive care was their usual source of medical care, we excluded from analysis those who visited a publicly supported clinic in the past 12 months but received only prenatal care, postpregnancy care or abortion services, and none of the other contraceptive services.

Statistical analysis

All analyses were performed using Stata version 16.1. In comparing proportions between surveys, we used the sampling weights provided by the NSFG and Stata’s svy command prefix, which produces standard errors and confidence intervals to account for the complex sampling design of the NSFG. We looked at descriptive measures comparing the three time periods of the NSFG and tested for statistical significance between years using logistic regression. We also compared key measures according to provider type and tested for differences between private providers and other types of providers. For some measures, we tested for statistically significant differences in service use according to women’s sociodemographic characteristics.

Sexual and Reproductive Health Services Received

Trends in SRH service use

Among women aged 15–44 in the United States, the proportion receiving any sexual or reproductive health (SRH) service remained relatively stable from 2006–2010 to 2015–2019; however, receipt of some specific services shifted significantly. In particular, receipt of preventive gynecologic services (Pap test or pelvic exam) declined over that time period and receipt of STI/HIV services increased (Table 1 and Figure 1).


  • Seventy percent of all women, or approximately 44 million, made at least one visit to receive sexual and reproductive health services in 2015–2019. This proportion has remained steady since 2006–2010.
  • The number and proportion of women receiving any contraceptive service in the past year has also remained relatively constant between 2006–2010 and 2015–2019, with 41% (26 million) of women receiving contraceptive services in 2015–2019. However, there was variation among the specific contraceptive services received.
    • The proportion of women receiving birth control counseling and birth control check-ups increased from 2006–2010 (17% and 22%, respectively) to 2011–2015 (19% and 25%, respectively), but remained steady between 2011–2015 and 2015–2019. The share of women receiving a birth control method or prescription remained unchanged throughout that time at 32–33%.
    • The share of women receiving sterilization counseling or operations varied slightly over the entire period, between 1% and 4%.
    • The proportion of women receiving emergency contraception counseling, pills or prescriptions also varied slightly over the period, between 2% and 3%.
  • The number of women receiving preventative gynecologic care (Pap tests or pelvic exams) fell from 63% in 2006–2010 to 60% in 2011–2015 and to 55% in 2015–2019. This change was driven by a steady decrease in the proportion of women receiving Pap tests, from 60% in 2006–2010 to 56% in 2011–2015 and to 50% in 2015–2019. The proportion of women receiving pelvic exams fell in the most recent period, from 55% in 2011–2015 to 50% in 2015–2019.
  • The proportion of women receiving any STI service increased from 26% in 2006–2010 to 32% in 2011–2015 and to 38% in 2015–2019. The same trend can be seen for STI testing (including counseling or treatment in 2006–2010 and 2011–2013), which increased steadily, from 16% to 25% to 34%.§ For HIV testing, there was a slight increase, from 19% in 2006–2010 to 21% in 2015–2019.
  • The proportion of women who reported receiving a pregnancy test from a medical provider increased from 19% in 2006–2010 to 21% in 2015–2019. Reported receipt of all other pregnancy-related services (prenatal care, postpregnancy care, abortion) remained stable over this period.

Finally, we were interested in examining the share of women who reported receipt of any SRH service and who continued to use prescription contraceptive methods over the past year but who did not report a contraceptive service visit. These are primarily women who received an IUD or implant more than 12 months prior to the interview. The proportion of women in this group increased from 1% in 2006–2010 to 3% in 2011–2015 and to 5% in 2015–2019. These women likely discussed the ongoing use of their long-acting contraceptive method during a visit for other SRH services, even if they did not report having done so. Combining these women with those who did report one or more contraceptive services reveals an increase in the overall proportion of women who either received a contraceptive service or were continuing use of a prescription contraceptive method during the year, from 41% in 2006–2010 to 46% in 2015–2019.

Trends and differentials in SRH service use by women’s characteristics

Receipt of SRH services varies widely according to women’s sociodemographic characteristics (Table 2). For example, in 2015–2019, the proportion of women who received a contraceptive service in the prior year was particularly low among those younger (aged 15–17) or older (aged 30–44), Hispanic women, women of lower income levels (less than 100% or 100–249% of the federal poverty level, or FPL), foreign-born women and those who are uninsured (Figure 2). Levels of receipt of services by sociodemographic characteristics also vary by type of service and are especially striking for receipt of STI/HIV services.


  • Overall, the number and proportion of women receiving any SRH care service over the prior year remained largely constant across time periods for most demographic groups. Women in the middle income category (100–249% of FPL) and non-Hispanic Black women both experienced an increase in the proportion receiving any SRH care between 2006–2010 and 2011–2015 (67% to 71% for those with household incomes 100–249% of FPL and from 77% to 82% for non-Hispanic Black women). These changes largely reflect increases in the proportion of women receiving STI services (see below). Similarly, a few groups experienced slight, but statistically significant, declines in receipt of any SRH service between either 2006–2010 and 2011–2015 (women aged 26–29 and those with Medicaid coverage) or 2011–2015 and 2015–2019 (women in the middle income category, Hispanic women, U.S.-born women and women with private insurance coverage). These changes largely reflect declines in the proportion of each group receiving preventive gynecologic services.
  • Although receipt of contraceptive services also remained relatively constant for most sociodemographic groups, there were a few important changes: Receipt of contraceptive services among non-Hispanic Black women increased from 37% in 2006–2010 to 43% in 2015–2019. Receipt of contraceptive services among women aged 15–17 increased from 25% in 2006–2010 to 31% in 2015–2019, and increased from 42% to 46% among those with incomes at or above 250% of FPL. Receipt of contraceptive services among women with private health insurance increased from 41% in 2006–2010 to 45% in 2015–2019, while it fell for women with Medicaid coverage from 43% to 39% over the same period.
  • Between 2006–2010 and 2015–2019, the overall proportion of women receiving preventative gynecologic services (Pap tests and/or pelvic exams) fell steadily and this trend was observed for most sociodemographic groups. Exceptions to this trend included non-Hispanic Black women, women in the other/multiple race category and foreign-born women—all of whom continued to receive preventive gynecologic services at the same rate across all three time periods.
  • In contrast, between 2006–2010 and 2015–2019, women’s receipt of STI/HIV services increased dramatically overall, and this trend was observed for nearly all sociodemographic groups. In fact, only women in the youngest age-group (aged 15–17), whose use of these services was much lower than for other age-groups, did not experience an increase in the proportion obtaining STI/HIV services over the three time periods. Women of all other sociodemographic characteristics experienced an increase, although the pace of increase varied somewhat across groups. For example, the proportion of non-Hispanic Black women obtaining these services rose from 43% in 2006–2010 to 61% in 2015–2019; for Hispanic women, the proportion rose from 29% in 2006–2010 to 38% in 2015–2019. (Again, some of the change may be due to the change in questionnaire wording, but there is no clear reason to expect that change would impact some sociodemographic groups more than others. The other change that may be more important is the overall increase in STI rates over the period, which may affect women differently according to their sociodemographic characteristics.)
  • Between 2006–2010 and 2015–2019, women’s receipt of pregnancy-related services increased slightly overall (from 21% to 23%), and this trend was experienced by only some sociodemographic groups: women aged 30–44, women with household incomes at or above 250% of FPL, non-Hispanic Black women, women born in the United States and women with private insurance. Among women who were covered by Medicaid, the proportion who received any pregnancy-related service declined.

Variation in source of care over time

A majority of U.S. women receive their SRH care from private providers as compared with publicly supported clinics. In 2015–2019, 77% of women receiving any SRH service went to a private provider, 17% to a publicly supported clinic and 6% to some other type of provider (Table 3). However, the proportion of women receiving care from private providers varied widely according to the specific SRH service received, with receipt of preventive gynecologic services most likely to be obtained from private providers (83%) and emergency contraceptive services least likely to be obtained from private providers (34–48%; Figure 3 and Appendix Table 1). In general, from 2006–2010 to 2015–2019, the proportion of women who received SRH services from publicly supported clinics decreased. The distribution of where women go for SRH care and the level of change varied according to the specific service received and the type of provider visited. Table 3 presents these trends for any SRH service and for each of the four composite SRH service measures (contraceptive services, gynecologic services, STI/HIV services and pregnancy-related services). Trends for each individual service are included in Appendix Table 1.


Contraceptive services
  • Between 2006–2010 and 2015–2019, the proportion of women visiting a private provider for any contraceptive service rose from 69% to 77%. During the same period, the proportion of women receiving contraceptive care at all publicly funded clinics fell from 27% to 18% and the share receiving this care at Title X clinics fell from 14% to 8% (Table 3 and Figure 4).


Other SRH services
  • For non-contraceptive SRH services, there is wide variation in the proportion of women receiving care from private providers compared with clinics. For example, a higher proportion of women rely on private providers for preventive gynecologic care (83% in 2015–2019) than for STI testing and treatment (70%).
  • Over the past decade, there has been an increase in the proportion of women receiving preventive gynecologic services (Pap tests and pelvic exams) from private providers, rising from 75% in 2006–2010 to 83% in 2015–2019. Only 14% of women receiving this care reported going to publicly supported clinics in 2015–2019, a decline from 21% in 2006–2010.
  • Among women receiving any STI service or HIV test, the majority obtain care from private providers and the proportion of women receiving this care from private providers has increased over time. However, the proportion receiving STI care from publicly supported clinics remains higher than the proportion for most other types of SRH services, indicating the ongoing importance of clinics for this service.
  • In 2015–2019, two-thirds of women receiving pregnancy-related care went to private providers (69%), increasing from 61% in 2006–2010; 21% received such care from publicly supported clinics, a decline from 29% in 2006–2010.

Trends and differentials in source of contraceptive care by women’s characteristics

We examined trends and differentials in the type of provider where women receive contraceptive services according to women’s sociodemographic characteristics (Table 4 and Table 5). Although there are wide differences in where women obtain care according to their characteristics, in general, the changes between 2006–2010 and 2015–2019 were found across most sociodemographic groups. More women of most sociodemographic groups are visiting private doctors for care and fewer are visiting public clinics. However, for some groups of women, publicly supported clinics remain an important source for their care. High proportions of young women, women of color, immigrant women, low-income women and women who are uninsured continue to rely on publicly supported clinics for their contraceptive care (Figure 5).


In this section, we present detailed information on women’s receipt of contraceptive services. The trends in where women received any SRH service closely resemble the trends seen for contraceptive services and are presented in Appendix Table 2. Similar data are available for receipt of a Pap test and receipt of STI testing, treatment or counseling (for all women and for women aged 15–25) and are presented in Appendix Tables 3, 4 and 5.

Age
  • All age-groups had an increase in use of private providers for contraceptive services and most had a decrease in the proportion visiting publicly funded clinics for care, with the steepest decline among women aged 15–17 (40% in 2006–2010 to 24% in 2015–2019; Figure 6). Among those aged 30–44, high proportions rely on private providers for their contraceptive care and this increased slightly in the most recent period (from 77% in 2011–2015 to 83% in 2015–2019).
  • Looking at trends by type of clinic visited, there were declines in the proportion of women of all ages who reported using Title X clinics for their contraceptive care. The proportion of women aged 18–25 using clinics not funded by Title X also declined, and there were similar declines in the proportions who reported visiting community clinics or family planning clinics for contraceptive care (from 9% and 13% in 2006–2010 to 5% and 6% in 2015–2019, respectively). Women aged 26–29 had declines in their use of most types of clinics (family planning, health department, and hospital outpatient or school based).


Income
  • Although there is wide variation in use of publicly funded clinics according to women’s family income level, across all income levels, use of clinics for contraceptive care was lower in 2015–2019 compared with 2006–2010 (Figure 7).
  • For women below 100% of FPL, there has been a steady increase in the proportion using private providers for contraceptive care, from 51% in 2006–2010 to 66% in 2015–2019. Among this group over the same time period, there were complementary decreases in use of any publicly supported clinics (44% to 29%), any Title X clinics (25% to 14%) and any family planning clinics (12% to 6%).
  • Somewhat similar decreases were found for women with family incomes between 100–249% of FPL, with a reduction in use of any public clinics from 34% in 2006–2010 to 25% in 2015–2019 and use of any Title X clinics (17% in 2006–2010 to 11% in 2015–2019).
  • As expected, the proportion of women with a family income of 250% of FPL or higher who relied on publicly supported clinics for contraceptive services was much lower than for women with lower family incomes (9% compared with 29% for women with income below 100% of FPL in 2015–2019). Use of clinics for this group has also decreased over time, from 16% in 2006–2010 to 9% in 2015–2019.
     

Race and ethnicity
  • High proportions of non-Hispanic White women report visiting private providers for their contraceptive care and this has risen over time (from 76% in 2006–2010 to 85% in 2015–2019), with complementary declines in the proportions who report use of publicly supported clinics (from 21% in 2006–2010 to 12% in 2015–2019; Figure 8).
  • In contrast, relatively high and unchanging proportions of non-Hispanic Black women (27–34%) relied on publicly supported clinics for contraceptive care from 2006–2010 to 2015–2019; there has been no increase in the proportion of non-Hispanic Black women receiving care from private providers over that time. Compared with non-Hispanic White women, lower proportions of Hispanic women and those in the other/multiple race category rely on private providers for their contraceptive care. However, these proportions have been rising: from 52% in 2006–2010 to 63% in 2015–2019 for Hispanic women and from 56% in 2006–2010 to 74% in 2015–2019 for women in the other/multiple race category.
  • For non-Hispanic White and Black women and Hispanic women, there has been a decline in use of Title X–funded clinics between 2006–2010 and 2015–2019. For women in the other/multiple race category, there has been a decrease in use of other (non–Title X) publicly supported clinics, from 25% in 2006–2010 to 10% in 2015–2019.


Nativity
  • Among women who were born in the United States, there was an increase in use of private providers and a decrease in use of clinics to obtain contraceptive services. In contrast, there have been no changes in foreign-born women’s use of private providers or all types of publicly funded clinics to obtain contraceptive services; relatively high proportions continue to rely on publicly funded clinics for their contraceptive care. Among foreign-born women, use of Title X–funded clinics did decline between 2006–2010 and 2015–2019 (from 21% to 13%), while use of the other providers category increased (from 5% to 10%).
Insurance status
  • Not surprisingly, there are stark differences in source of care according to women’s current health insurance status, with some increase in the proportion relying on private providers among those with private insurance (82% in 2006–2010 to 86% in 2015–2019) or Medicaid (50% to 62%), and no significant shift among those who are uninsured (Figure 9). In contrast to all other groups, women who are currently uninsured are least likely to use private providers (45% in 2015–2019) and most likely to rely on publicly funded clinics (46% in 2015–2019). They did experience a decline in the proportion using Title X–funded clinics (from 32% in 2006–2010 to 22% in 2015–2019), but no change in the proportion using clinics not funded by Title X.


Provider-specific trends in patient characteristics

We also examined the overall and provider-specific distributions of women receiving contraceptive services, according to their sociodemographic characteristics, to understand if the changes in where women go for their SRH care are changing the sociodemographic mix of patients being served by different types of providers. This section includes information on how women paid for their contraceptive services, looking at changes in payment source over time by provider type and compared with changes in women’s health insurance status. Table 6 provides summary information on the sociodemographic distributions of all women receiving any SRH service and any contraceptive service, and compares those receiving care from private providers with those visiting publicly supported clinics. Appendix Table 6 provides more detailed information on the sociodemographic distributions of women receiving contraceptive care from all types of publicly supported clinics.

Overall, the distribution of women receiving any SRH service or any contraceptive service in the prior year by sociodemographic characteristics remained similar across the three time periods for many characteristics (Table 6). Focusing on the distributions for women receiving contraceptive services (second page of Table 6), the distributions of all women (total column) by age-group, income level and nativity were essentially unchanged across the three time periods. The most significant changes overall were in women’s current health insurance status (Figure 10) and in how women paid for their care; for example, the proportion of women using private health insurance to pay for contraceptive care rose from 63% in 2006–2010 to 72% in 2015–2019 (Figure 11).


Similar to all women receiving contraceptive care, there were few changes in the sociodemographic distributions of women getting care from private providers. At the same time, among women getting contraceptive care from publicly supported clinics, the distributions by some sociodemographic characteristics shifted considerably over the three time periods.

Age

Between 2006–2010 and 2015–2019, the age distribution of women receiving contraceptive services from private providers remained constant, while the age distribution of those getting care from publicly supported clinics became older (Figure 12). This trend has reduced differences between publicly supported clinics and private providers in terms of patient age. For example, the proportion of women aged 30–44 visiting publicly supported clinics rose 8 percentage points, from 23% in 2006–2010 to 31% in 2015–2019.


Income

Between 2006–2010 and 2015–2019, the income distribution of women receiving contraceptive services from private providers remained relatively constant—more than half of women in all time periods had family incomes of at least 250% of FPL. In contrast, between 2006–2010 and 2011–2015, publicly supported clinics had an increase in the proportion of contraceptive patients who were below 100% of FPL (from 36% to 43%). During the subsequent period, between 2011–2015 and 2015–2019, this proportion fell back to previous levels, while the proportion of women whose family income was 100–249% of FPL rose from 32% to 41%. The proportion of women whose income was at least 250% of FPL remained constant over the three periods at about one-quarter of all women receiving contraceptive care from clinics.

Race and ethnicity

The share of women receiving services from publicly supported clinics who are non-Hispanic White fell from 50% in 2006–2010 to 38% in 2015–2019 (Figure 13), while the proportions who are Hispanic or non-Hispanic Black increased somewhat, though not significantly. Similarly, among women receiving contraceptive care from private providers, the proportion who are non-Hispanic White declined slightly over the same period (from 71% to 64%) while the proportion in the other/multiple race category increased (from 6% to 9%).


Nativity

In 2015–2019, publicly supported clinics served a higher proportion of women who were not born in the United States (23%) compared with private providers (9%), and this has not changed significantly over time.

Insurance status

Among women who received contraceptive services from private providers, the proportion currently covered by private health insurance remained unchanged at 77% over all three time periods, while the proportion who were covered by Medicaid increased (from 13% to 18%) and the proportion uninsured decreased (from 9% to 5%; Figure 14). Among women who received their care from publicly funded clinics, the proportion currently covered by private insurance also remained steady at only 37%, while the proportion covered by Medicaid rose (30% to 39%) and proportion uninsured fell (33% to 24%).


Payment type

We compared the distribution of women according to their current health insurance status with the distribution of how they paid for their contraceptive care for each provider type and found the proportions were similar over time for women receiving care from private providers. In contrast, the distribution of women according to how they paid for contraceptive care received from publicly funded clinics shifted significantly over the three time periods and is quite different from the pattern observed for insurance coverage among the same group of women. Over time, the proportion of women paying for contraceptive services at publicly funded clinics using private insurance rose (from 24% to 37%), as did the proportion paying for care using Medicaid (27% to 35%), with matching declines in out-of-pocket payments or care received for free (Figure 15).


Variation in the mix of SRH services received

Receipt of specific services

Among women who received any SRH service during the prior year, we examined the specific services they received along with the mix of combined services they received. Most women receive multiple services each year. In 2015–2019, among those receiving any SRH service, 39% received at least one service from three or four of the main service groups (contraceptive services, gynecologic services, STI/HIV services and pregnancy-related services), rising from 33% in 2006–2010 (Table 7). Among women receiving SRH care from publicly funded clinics, nearly half (46%) reported receiving services from three or four of the service groups.

More than half of women receiving any SRH care received at least one contraceptive service (56% in 2006–2010, rising to 59% in 2015–2019). For women going to private providers, the proportion receiving contraceptive services increased significantly (from 54% to 59%). There has been little change over time in the proportion receiving contraceptive services for women going to clinics (from 66% to 63%), although these proportions remain higher than for women going to private providers. In contrast, the proportion of women receiving preventive gynecologic care decreased over time, from 88% in 2006–2010 to 83% in 2011–2015 and to 77% in 2015–2019, and the proportion of women receiving STI/HIV services increased, from 36% in 2006–2010 to 44% in 2011–2015 and to 54% in 2015–2019. These trends are similar for both private providers and publicly supported clinics, although the levels are different: Higher proportions of those going to private providers received preventive gynecologic care and lower proportions received STI services, compared with those going to clinics. (Further detail by type of clinic visited can be found in Appendix Table 7.)

Mix of SRH services received

There were changes over time, and variations by provider type, in the combined mix of SRH services that women received in the prior year. In general, women who received SRH care from private providers received a more limited mix of preventive gynecologic and contraceptive services, whereas women who received care from clinics received a broader mix of services that more often included STI/HIV care. And, over time, more women at all provider types reported receipt of multiple SRH services and fewer reported only receiving contraceptive care, with or without preventive gynecologic care, or only preventive gynecologic care and no other SRH service during the year.

  • Over time, the proportion of women who reported receiving a combination of contraceptive and STI/HIV care increased from 21% in 2006–2010 to 25% in 2011–2015 and to 31% in 2015–2019, while the proportion who reported receiving only contraceptive services or only preventive gynecologic care in the prior year fell (from 27% to 22% for contraceptive care and from 24% to 15% for preventive gynecologic care) over the same time period (Table 8 and Figure 16).
  • These trends occurred among women who relied on both private providers and publicly supported clinics. Among women receiving care from private providers, the proportion who received a combination of contraceptive and STI/HIV services increased from 18% in 2006–2010 to 30% in 2015–2019, while there were significant decreases in the proportion receiving only contraceptive care (28% to 23%) or only preventive gynecologic care (28% to 17%). Among women who received care from publicly supported clinics, the proportion receiving both contraceptive and STI/HIV care rose from 32% to 42% and the proportion receiving only contraceptive care fell from 24% to 15%.


  • In all years, a higher proportion of those relying on clinics for SRH services received a combination of contraceptive and STI/HIV care compared with those relying on private providers. For example, in 2015–2019, a higher percentage of women receiving SRH care from Title X clinics reported receiving both contraceptive services and STI/HIV care (49%) compared with women relying on private providers (30%; Figure 17).
  • In contrast, during the same period, a higher proportion of women relying on private providers reported receipt of only preventative gynecologic care or only contraceptive services during the prior year (17% and 23%, respectively) compared with women relying on publicly supported clinics for these services (9% and 15%, respectively).


Mix of SRH services received by clinic type

We further analyzed the mix of services women received at publicly supported clinics according to the type of clinic visited: community clinic, family planning clinic, public health department clinic, and hospital outpatient or school-based clinic (Table 9). Similar to the prior analysis examining clinics by funding status, we found variation in the mix of services received, over time and according to the type of clinic providing care.

  • The proportion of women who reported receiving both contraceptive and STI/HIV services increased between 2006–2010 and 2015–2019 for those who went to community clinics (24% to 37%) and family planning clinics (43% to 62%).
  • The proportion of women reporting receipt of contraceptive services only, without any STI care or pregnancy-related services, fell among those receiving SRH care from both community clinics (19% to 10%) and family planning clinics (29% to 11%).
  • In 2015–2019, women who received care from community clinics or family planning clinics were more likely to have received contraceptive services with STI/HIV care (37% and 62%, respectively) than those who went to private providers (30%).
  • In 2015–2019, women who went to health department clinics were more likely to report receipt of STI/HIV care without contraceptive services (29%) and less likely to report only receipt of preventive gynecologic care (6%) compared with women visiting private providers (21% and 17%, respectively).
Usual source of care

Many women who receive SRH services from publicly funded clinics report that the clinic is their usual source for medical care of any kind, not just SRH, indicating that these clinics often offer women an entry point into the health care system. In our last report, 63% of women receiving care at clinics reported the clinic to be their usual source of medical care.1 (Note that this question was only asked of women who reported going to a clinic for SRH services; women who reported care from private providers were not asked if the private provider visited for SRH care was their usual source of medical care.) This report updates the information from our earlier analysis, including information on how women’s reports of the clinic being their usual source of care vary according to the respondents’ characteristics. Across the three time periods, nearly two-thirds (63% to 65%) of women who visited a publicly funded clinic for one or more contraceptive or other related SRH care services** in the prior year reported that the clinic was their usual source for medical care (Table 10). This percentage varies according to the type of clinic visited and by women’s characteristics, indicating that particularly for women of color and uninsured women, publicly funded clinics are critical to their ability to enter the health care system and get both the SRH care they need and broader medical care or referrals for such care.

  • In 2015–2019, among women who received contraceptive or related services from publicly funded clinics, 60% of those visiting Title X–funded clinics and 68% of those visiting clinics not funded by Title X reported that the clinic was their usual source of care. This difference was not statistically significant.
  • For specific types of clinics, these differences were greater: A higher proportion of women who visited a community clinic reported it to be their usual source of medical care (77%), compared with those going to family planning clinics (47%) or to health department clinics (63%). These outcomes are expected, since community health clinics offer primary care services along with SRH care.
  • Among women who visited publicly supported clinics for contraceptive or related services in 2015–2019, non-Hispanic Black women and Hispanic women were more likely (74% and 69%, respectively) than non-Hispanic White women (59%) to report the clinic as their usual source of medical care (Figure 18). Similarly, foreign-born women compared with U.S.-born women (73% vs. 63%) and women with Medicaid coverage or those who were uninsured compared with privately insured women (71% and 70% vs. 53%) were more likely to report the clinic as their usual source of care.
  • Women aged 15–17 were much less likely than women of most other age-groups to report the clinic as their usual source of care across all survey time periods, although in 2015–2019, this comparison was statistically significant only for women aged 15–17 compared with those aged 30–44 (51% vs. 72%).


Discussion

Over the last two decades, the delivery and financing of health care in the United States has undergone a profound transformation, driven first by numerous reforms early in the 21st century and culminating with passage of the Affordable Care Act (ACA) in 2010. In the 10 years since the ACA was enacted, millions of previously uninsured individuals gained either public or private health insurance coverage and many of the law’s provisions have expanded access to sexual and reproductive health (SRH) care in numerous ways.24 This report describes trends and patterns in how these policy expansions have translated to women’s actual use of SRH services over the period prior to and during implementation of the ACA.

Delivery and use of SRH care and challenges that persist

Share of women receiving SRH services has been stable. Between 2006–2010 and 2015–2019, 70–73% of women of reproductive age reported receipt of one or more SRH services in the prior year. However, this stability masks significant shifts for some SRH services that are moving in opposite directions and therefore offset each other. Specifically, the proportion of women obtaining annual preventive gynecologic care (Pap test or pelvic exam) declined steadily over this period; this downward trend is likely due to changes in clinical recommendations that no longer advise annual cervical cancer screening for most women. At the same time, the share of women obtaining STI testing increased considerably. There are several factors that may have influenced this upward trend. First, it is likely a reflection of rising rates of STI infection. For example, the national rate for chlamydia infection among women rose 25% between 2006 and 2015 (from 511 to 640 per 100,000).25 Second, it is possible that increased coverage of STI counseling and screening as preventive care under the ACA26 and new guidance from the Centers for Disease Control and Prevention (CDC) on best practices for quality family planning that includes STI testing have contributed to this rise.3 And finally, a change in the wording of the STI question on the National Survey of Family Growth (NSFG) may be responsible for some of the observed change.

Receipt of contraceptive services has also remained stable. Somewhat surprising is the finding that overall receipt of any contraceptive service remained stable at 40–42% of women of reproductive age from 2006–2010 to 2015–2019. We were expecting that provisions of the ACA would lead to more women accessing contraceptive services. Once again, other contemporaneous changes may be masking the full impact. Shifting patterns of contraceptive method use, and increased use of long-acting reversible contraceptive (LARC) methods specifically, may have played a role. Between 2008 and 2014, users of LARC methods rose from 6% to 14% of all contraceptive users,27 driven in part by the guarantees under the ACA for a full range of contraceptive methods to be provided with no cost sharing by patients. When we accounted for women using LARC methods, we found that there was a significant increase, from 41% in 2006–2010 to 46% in 2015–2019, in the share of women reporting contraceptive services or use of a reversible prescription method with other SRH services.

Receipt of contraceptive services (as originally measured) did rise between 2006–2010 and 2015–2019 for women aged 15–17, for women with family incomes at or above 250% of the federal poverty level (FPL), for non-Hispanic Black women and for women with private insurance. Some of these shifts may be attributed to the ACA requirement that private health insurance plans cover the full range of contraceptive methods and preventive services without copayments. A second factor may be a decline in use of contraceptive sterilization in favor of reversible methods over this time period,27 especially for older women, higher income women and non-Hispanic Black women, which may have contributed to an increased need for ongoing contraceptive services among these groups.

Use of private providers for SRH and contraceptive services has increased. Generally, there has been a shift over time in where women obtain SRH services, with more women receiving care from private providers and fewer served by publicly supported clinics. This shift can likely be attributed, at least in part, to higher numbers of women being covered by private or public health insurance than in the past and to the greater likelihood that their health insurance covers contraceptive and other SRH services, both consequences of provisions implemented as part of the ACA. Having health insurance coverage allows women greater flexibility in choosing where to seek care and gives more women access to private providers if that is the type of care they prefer.

Between 2006–2010 and 2015–2019, significant shifts away from clinics and toward greater use of private providers were found for women in all income groups, non-Hispanic White and Hispanic women, women in the other/multiple race category, U.S.-born women and women with either private or public health insurance. The shift away from publicly funded clinics to private providers for contraceptive care is particularly strong for adolescent and young adult women, who had previously, and disproportionately, gone to publicly funded clinics. This change was reported through the 2015 time period16 and was associated with both improved insurance coverage and a greater propensity among young women to use their private insurance for contraceptive services. The continued shift toward private providers after 2015 likely reflects improved contraceptive coverage by insurance companies, as well as improved knowledge and greater willingness among young women to use their coverage. As a result, younger women now are more similar to older women in terms of where they go to obtain contraceptive care.

Women receive multiple SRH services each year. Understanding the mix of services women receive in a variety of settings gives a fuller picture of how complete their SRH care is, as well as what demands are placed on different provider types in order to meet the needs of their patients. Most women receive several different types of SRH care each year and the mix of services received has varied over time and according to the type of provider visited. For example, the share of women who received only preventive gynecologic care during the year fell from 24% to 15% over the period 2006–2010 to 2015–2019. More women accessed only preventive gynecologic services from private providers (17% of private provider patients) than from clinics (9% of clinic patients). The most common mix of services received by women in 2015–2019 was contraceptive services plus STI or HIV testing, received by one-third (31%) of women getting any care, up from 21% in 2006–2010. And, compared with women going to private providers, a higher proportion of women who received SRH care from clinics reported a mix of services that includes both contraceptive care and STI or HIV testing (42% for clinics compared with 30% for private providers); also, the share receiving this mix rose for both provider types over the study period. These increases may reflect the same factors noted earlier for the increase in STI testing, including more comprehensive provision of family planning care, in line with recommendations from the CDC on quality family planning services.3

Publicly funded clinics remain critical sources of SRH care. In all time periods, lower income women, women of color, foreign-born women and those with Medicaid coverage or who are uninsured were more likely to rely on publicly funded clinics compared with other groups of women. For many of these women, there was no shift away from clinics and toward higher use of private providers for contraceptive care over the period of this study. Specifically, for non-Hispanic Black women, immigrant women and uninsured women, reliance on publicly funded clinics for contraceptive care was mostly unchanged from 2006–2010 to 2015–2019; in the most recent period (2015–2019), between 27% and 46% of women in those groups received care from clinics.

Since publicly funded clinics are designed to provide health care access for the most underserved groups, these patterns are not unexpected, and most publicly funded clinics provide as good, if not better, care than do private providers. But clinics face numerous challenges and understanding the extent to which some groups of women rely on their services points to the critical need for continued public funding for clinics. In areas where clinics have not been funded adequately or have had to close sites or cut back on services or hours, it may mean that the women who depend on their services are faced with reduced options for care and may need to travel farther than previously to obtain the care they need.

As more women gained health insurance under the ACA, and some shifted from publicly supported clinics to private providers for their contraceptive care, there has been a corresponding shift in the demographic profiles of women obtaining care from each type of provider. Publicly funded clinics have seen a decline in the overall number of patients served, with a corresponding increase in the share of women that remain who face overlapping systemic barriers and marginalization. Specifically, we found an increase from 2006–2010 to 2015–2019 in the proportions of publicly funded clinic patients who have a low income (less than 250% of FPL), are uninsured or have Medicaid coverage and a decrease in the proportion who are non-Hispanic White. Often there are increased costs for clinics when serving marginalized populations, including added time needed for counseling, care for multiple service needs, and attention to ensuring referrals are made and kept for other health problems identified.

Two-thirds of clinic patients have no other usual source for medical care. The importance of publicly supported clinics as an entry point into the health care system for millions of marginalized women is further supported by the consistent reporting that these clinics are the usual source for any medical care for many patients—65% of women going to clinics for SRH services reported this in 2015–2019. Publicly funded clinics are crucial access points for women of color, in particular. For instance, 74% of non-Hispanic Black women report that the clinic is their usual source for medical care. Similarly, high proportions of foreign-born women (73%), women with Medicaid coverage (71%) and uninsured women getting SRH care from clinics (70%) rely on clinics as their usual source for medical care.

Big changes have occurred in payment for SRH care services. Improved access to health care coverage under the ACA has resulted in more women having private or public health insurance and fewer who are uninsured. This has led to a decline in the proportion of women receiving contraceptive services at both private providers and publicly funded clinics who are uninsured; and, among clinics, a significantly higher share of women who are able to pay for their care with either private insurance (rising from 24% in 2006–2010 to 33% in 2015–2019) or Medicaid (rising from 27% to 35%). These trends suggest that many clinics have been able to capitalize on new funding streams stemming from the ACA through contracts with insurance plans and other improved administrative processes needed to collect insurance payments. These processes are not cheap and add to the myriad of rising costs that clinics must incur both to survive and to continue to provide high-quality care. Moreover, as Medicaid does not reimburse for the full cost of serving patients, the increase in the share of patients covered by Medicaid means an increased gap that must be filled by other sources, such as Title X funds or other state or local funds.

Next steps

This analysis indicates some positive effects that the ACA has had on women’s ability to obtain needed contraceptive and other SRH care, but it also reveals that not all women have benefited equally from these policies, further evidence of ongoing systemic injustice and marginalization of some groups. Relatively high proportions of women of color, foreign-born women and those who are uninsured remain dependent on publicly funded clinics for their SRH care and report that this provider type is their usual source for medical care. It is unclear to what extent this reliance reflects women’s preferences, the constraints they face in obtaining care or the reality that many remain uninsured or underinsured and clinics are the only place where they can obtain affordable SRH care. In any case, clinics are challenged by the fact that their patient base has shifted. In order to meet this situation and the needs of their patients, clinics may need additional resources and may need to reassess the range and types of services they offer—in some cases, this could mean taking a broader approach to the SRH care they provide.

Both for women who already had health insurance, and those who gained insurance coverage under the ACA, our findings show a positive effect of the policy guaranteeing contraceptive coverage, with increased use of contraceptive services once the increased use of LARC methods is factored in. At the same time, the shift away from clinics and toward private providers that was made possible for many women by the rise in private health insurance coverage needs further investigation. Private providers, especially those that do not focus on women’s health care, may need additional education and training to ensure that their patients’ needs are fully met.

Following trends in health insurance, how women pay for SRH services and where they go for this care over the next few years as future rounds of the NSFG are released will be crucial to understanding the impact of recent federal, state and local attacks on clinics’ provision of SRH care services. In particular, it will be useful to track the effects of the Trump-Pence administration’s implementation of a "gag rule" that prevented clinics receiving Title X funding from discussing or referring patients to abortion providers. The loss of Title X providers from the network when the rule went into effect in 2019 likely has had a disproportionate impact on women of color and those who are already marginalized, and it will take some time to reverse this damage.

Our findings about the ongoing, critical importance of publicly funded clinics for some women in order to meet their SRH care needs have been amplified by events over the past year.28 Both attacks on the ACA and job loss due to the COVID-19 pandemic have resulted in stagnating and now potentially falling numbers of women with private health insurance. We can expect this to lead to more women turning to publicly funded clinics for their care. Moving forward, it will be crucial for advocates and policymakers to ensure robust funding for the federal Title X program, rebuild the Title X network and provide continued support to the wider publicly funded clinic network so that all women who need and want SRH care services are able to obtain quality care.

Footnotes

*This analysis uses "women" to match the language in the National Survey of Family Growth female questionnaire. Survey respondents are recorded as either female or male based on their response to eligibility screening questions and are not asked about their gender identity.

†NSFG respondents or a member of their household report potential participants as either male or female at the time they are screened for eligibility to participate in the survey. These screening questions determine which questionnaire (male or female) each person is routed to take. This analysis does not use data from the NSFG male survey because it does not include certain key components, such as details about provider type and payment source.

‡Defined as home, military site, lab or blood bank, prison, jail, mobile test site, rehab center, in-store health clinic.

§A change in questionnaire wording occurred midway through the period 2011–2015, when the phrase "counseling or treatment" was dropped, leaving only the question about testing. Although one would expect the wording change to lower the proportion of women responding positively to this item, it may have had the opposite effect, with testing in the earlier period having been undercounted among some respondents who interpreted the question as meaning they had received all of the services (testing, treatment and counseling) rather than any of the services.

**We excluded women whose only visit to a publicly funded clinic was for pregnancy-related care.

References

1. Frost JJ, U.S. Women’s Use of Sexual and Reproductive Health Services: Trends, Sources of Care and Factors Associated with Use, 1995–2010, New York: Guttmacher Institute, 2013, http://www.guttmacher.org/pubs/sources-of-care-2013.pdf.

2. Frost JJ et al., Publicly Funded Contraceptive Services at U.S. Clinics, 2015, New York: Guttmacher Institute, 2017, https://www.guttmacher.org/report/publicly-funded-contraceptive-services-us-clinics-2015.

3. Gavin L and Pazol K, Update: Providing quality family planning services — recommendations from CDC and the U.S. Office of Population Affairs, 2015, Morbidity and Mortality Weekly Report, 2016, Vol. 65, No. 9, doi:10.15585/mmwr.mm6509a3.

4. Institute of Medicine, Clinical Preventive Services for Women: Closing the Gaps, Washington, DC: The National Academies Press, 2011, https://www.nap.edu/catalog/13181/clinical-preventive-services-for-women-closing-the-gaps.

5. Sonfield A et al., U.S. Insurance coverage of contraceptives and the impact of contraceptive coverage mandates, 2002, Perspectives on Sexual and Reproductive Health, 2004, 36(2):72–79, https://www.guttmacher.org/journals/psrh/2004/us-insurance-coverage-contraceptives-and-impact-contraceptive-coverage.

6. Atkins DN and Bradford WD, Changes in state prescription contraceptive mandates for insurers: the effect on women’s contraceptive use, Perspectives on Sexual and Reproductive Health, 2014, 46(1):23–29, doi:10.1363/46e0314.

7. Sonfield A and Gold RB, Medicaid Family Planning Expansions: Lessons Learned and Implications for the Future, New York: Guttmacher Institute, 2011, https://www.guttmacher.org/report/medicaid-family-planning-expansions-lessons-learned-and-implications-future.

8. Patient Protection and Affordable Care Act, PL 111-148, Mar. 23, 2010.

9. Sonfield A et al., Impact of the federal contraceptive coverage guarantee on out-of-pocket payments for contraceptives: 2014 update, Contraception, 2015, 91(1):44–48, doi:10.1016/j.contraception.2014.09.006.

10. U.S. Preventive Services Task Force, Screening for cervical cancer: U.S. Preventive Services Task Force recommendation statement, JAMA, 2018, 320(7):674–686, doi:10.1001/jama.2018.10897.

11. Sonfield A, U.S. insurance coverage, 2018: The Affordable Care Act is still under threat and still vital for reproductive-age women, Guttmacher Institute, 2020, https://www.guttmacher.org/article/2020/01/us-insurance-coverage-2018-affordable-care-act-still-under-threat-and-still-vital.

12. Dawson R, Trump administration’s domestic gag rule has slashed the Title X network’s capacity by half, Guttmacher Institute, 2020, https://www.guttmacher.org/article/2020/02/trump-administrations-domestic-gag-rule-has-slashed-title-x-networks-capacity-half.

13. Frost JJ, Trends in U.S. women’s use of sexual and reproductive health care services, 1995–2002, American Journal of Public Health, 2008, 98(10):1814–1817, doi:10.2105/AJPH.2007.124719.

14. Frost JJ, Public or private providers? U.S. women’s use of reproductive health services, Perspectives on Sexual and Reproductive Health, 2002, 33(1):4–12, https://www.guttmacher.org/journals/psrh/2002/01/public-or-private-providers-us-womens-use-reproductive-health-services.

15. Frost JJ, U.S. women’s reliance on publicly funded family planning clinics as their usual source of medical care, paper presented at the Research Conference on the National Survey of Family Growth, Hyattsville, MD, Oct. 16 and 17, 2008.

16. Frost JJ and Lindberg LD, Trends in receipt of contraceptive services: young women in the U.S., 2002–2015, American Journal of Preventive Medicine, 2019, 56(3):343–351, doi:10.1016/j.amepre.2018.10.018.

17. National Center for Health Statistics (NCHS), Public-use data file documentation, 2006–2010 National Survey of Family Growth (NSFG), User's Guide, Hyattsville, MD: NCHS, 2011, https://www.cdc.gov/nchs/data/nsfg/NSFG_2006-2010_UserGuide_MainText.pdf.

18. NCHS, Public-use data file documentation, 2011–2013 NSFG, User's Guide, Hyattsville, MD: NCHS, 2014, https://www.cdc.gov/nchs/data/nsfg/NSFG_2011-2013_UserGuide_MainText.pdf.

19. NCHS, Public-use data file documentation, 2013–2015 NSFG, User's Guide, Hyattsville, MD: NCHS, 2016, https://www.cdc.gov/nchs/data/nsfg/nsfg_2013_2015_userguide_maintext.pdf.

20. NCHS, Public-use data file documentation, 2015–2017 NSFG, User's Guide, Hyattsville, MD: NCHS, 2018, https://www.cdc.gov/nchs/data/nsfg/NSFG_2015_2017_UserGuide_MainText.pdf.

21. NCHS, Public-use data file documentation, 2017–2019 NSFG, User's Guide, Hyattsville, MD: NCHS, 2020, https://www.cdc.gov/nchs/data/nsfg/NSFG-2017-2019-UG-MainText-508.pdf.

22. Lindberg L et al., Abortion reporting in the United States: an assessment of three national fertility surveys, Demography, 2020, 57(3):899–925, doi:10.1007/s13524-020-00886-4.

23. Lepkowski JM et al., The 2006–2010 National Survey of Family Growth: sample design and analysis of a continuous survey, Vital and Health Statistics, 2010, Series 2, No. 150.

24. Keller L and Sonfield A, The first 10 years of the ACA: We must protect and build on major gains in sexual and reproductive health, Guttmacher Institute, 2020, https://www.guttmacher.org/article/2020/03/first-10-years-aca-we-must-protect-and-build-major-gains-sexual-and-reproductive.

25. Centers for Disease Control and Prevention, Sexually Transmitted Disease Surveillance 2018, Atlanta: U.S. Department of Health and Human Services, 2019, https://www.cdc.gov/std/stats18/STDSurveillance2018-full-report.pdf.

26. U.S. Centers for Medicare and Medicaid Services, Preventive care benefits for women, https://www.healthcare.gov/preventive-care-women/.

27. Kavanaugh ML and Jerman J, Contraceptive method use in the United States: trends and characteristics between 2008, 2012 and 2014, Contraception, 2018, 97(1):14–21, doi:10.1016/j.contraception.2017.10.003.

28. Sonfield A et al., COVID-19 job losses threaten insurance coverage and access to reproductive health care for millions, Health Affairs Blog, 2020, https://www.healthaffairs.org/do/10.1377/hblog20200728.779022/full/.

Suggested Citation

Frost JJ, Mueller J and Pleasure ZH, Trends and Differentials in Receipt of Sexual and Reproductive Health Services in the United States: Services Received and Sources of Care, 2006–2019, New York: Guttmacher Institute, 2021, https://www.guttmacher.org/report/sexual-reproductive-health-services-i….

DOI: https://doi.org/10.1363/2021.33017

Acknowledgments

This report was written by Jennifer J. Frost, Jennifer Mueller and Zoe H. Pleasure. It was edited by Chris Olah and its figures were designed by Michael Moran. Research support was provided by Parisa Thepmankorn, Hannah Whitehead, Elizabeth Witwer and Noah Zazanis. The authors gratefully acknowledge the feedback and contributions of Laura Lindberg and Ruth Dawson. All are current or former staff at the Guttmacher Institute.

This research was supported, in part, by a grant from the David and Lucile Packard Foundation. The views expressed are those of the authors and do not necessarily reflect the positions and policies of the donor.