Key Points
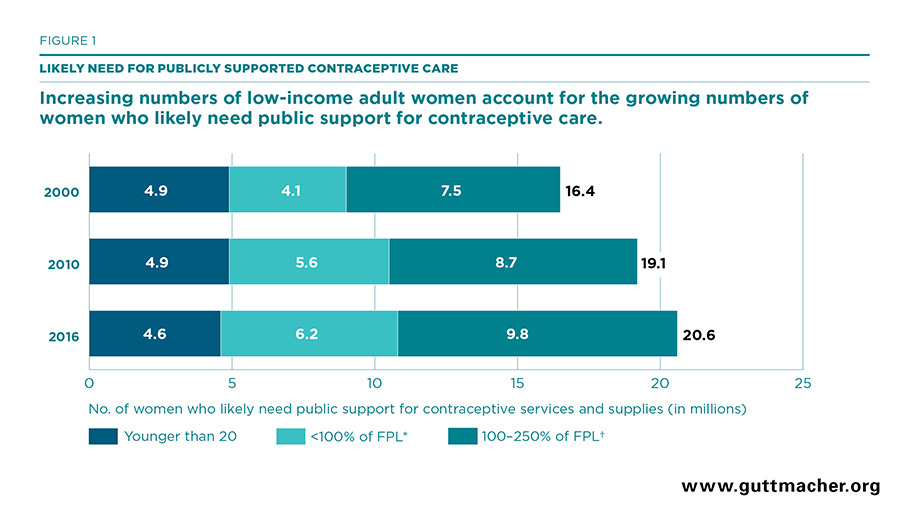
- In 2016, 20.6 million U.S. women were likely in need of public support for contraceptive services and supplies.
- Between 2010 and 2016, the number of women likely in need of public support for contraceptive services and supplies rose 8% overall. Among women below 250% of federal poverty guidelines, there was a 12% increase; among adolescents, there was a 5% decline.
- Between 2013 and 2016, the number of women likely in need of public support for contraceptive services who had neither public nor private health insurance fell more than one-third (36%), from 5.6 million to 3.6 million. States that implemented the Affordable Care Act’s Medicaid expansion experienced particularly large declines.
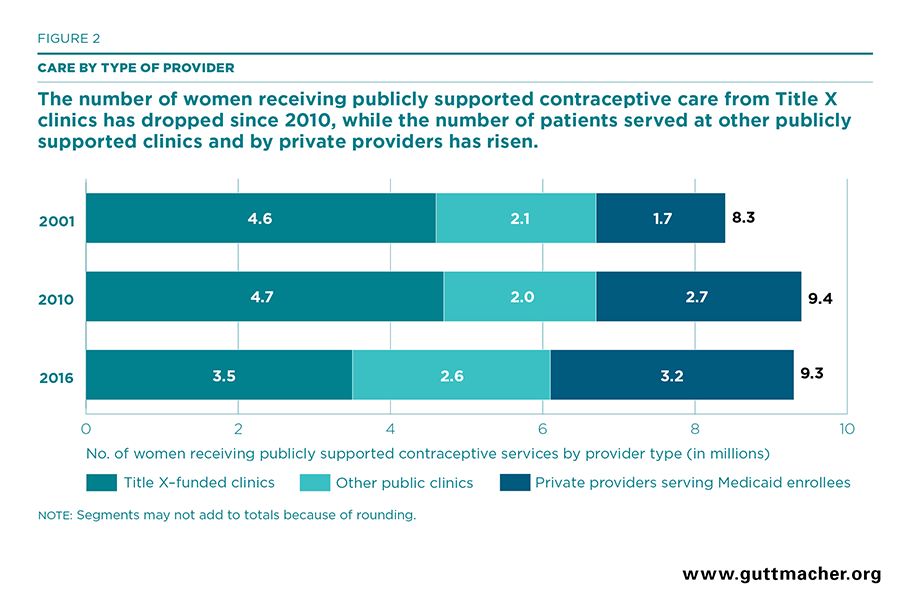
- Between 2010 and 2016, the overall number of women receiving publicly supported contraceptive services remained stable at about nine million women. However, the number of women served by different types of providers shifted dramatically over this period.
- While Title X–funded sites continued to serve the largest segment of women receiving publicly supported care, their patient load fell by 25%, from 4.7 million in 2010 to 3.5 million in 2016. The number of contraceptive patients served by other public clinics that do not receive Title X funding rose by 29% and the number of women receiving Medicaid-funded contraceptive services from private providers rose by 19%.
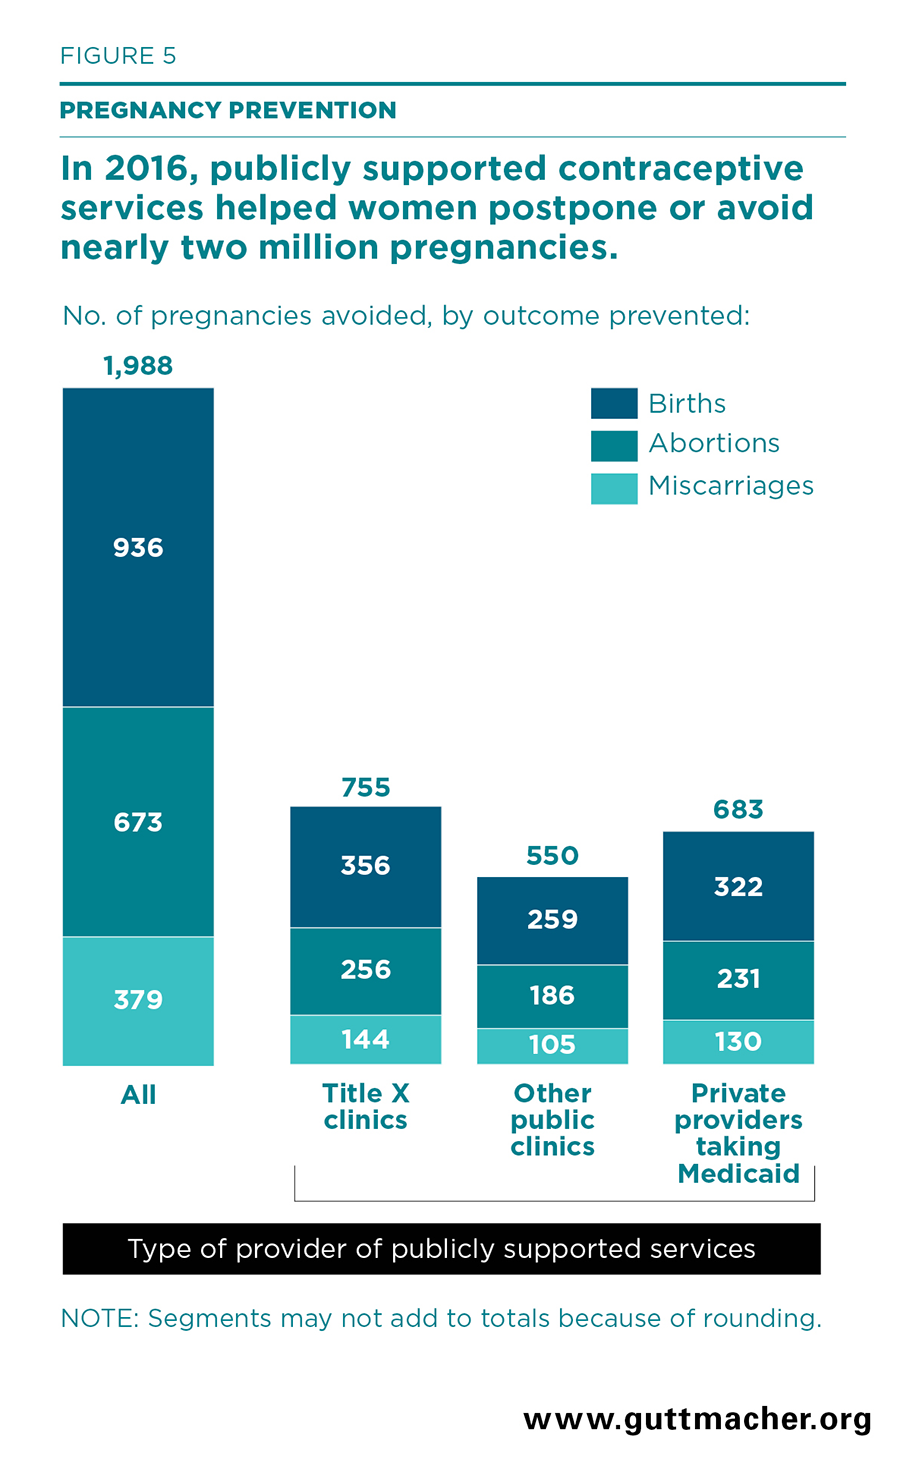
- In 2016, women who obtained contraceptive services from all publicly supported providers were able to postpone or avoid two million pregnancies that they would have been unable to prevent without access to publicly supported care. Women who obtained contraceptives from Title X–funded clinics avoided 755,000 pregnancies.
- Screening and vaccination services provided at family planning visits with all publicly supported providers helped patients avoid more than 12,000 cases of pelvic inflammatory disease and nearly 2,000 cases of cervical cancer in 2016. More than 100,000 chlamydia infections, 18,000 gonorrhea infections and 800 cases of HIV were prevented among the partners of women obtaining publicly funded contraceptive care.