U.S. Teenage Pregnancies, Births and Abortions, 2011: State Trends by Age, Race and Ethnicity

This publication has been updated. Please see here for the latest version.

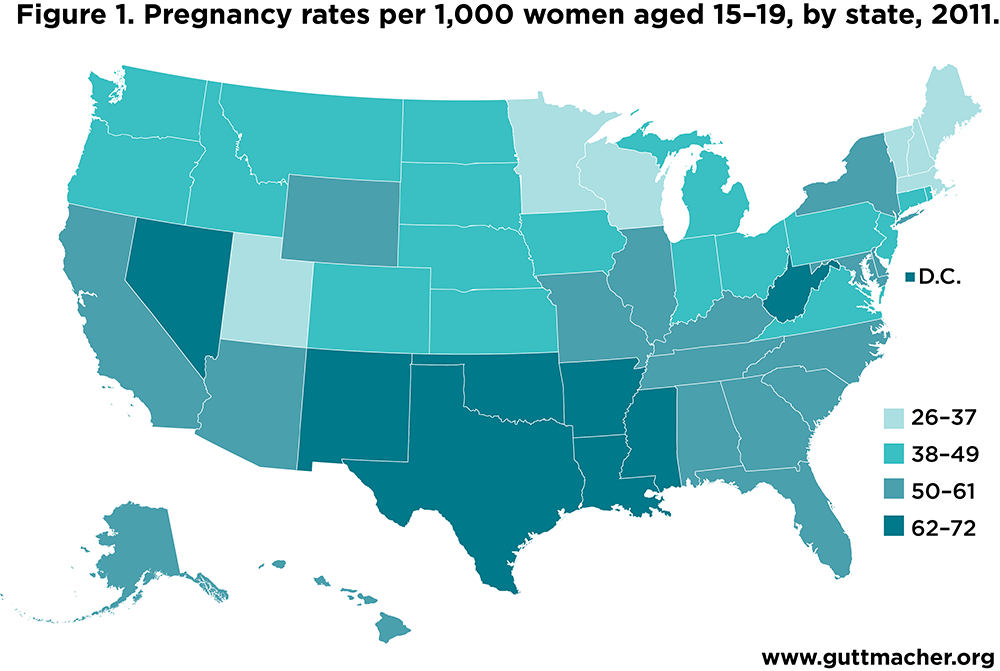
This report contains statistics for 2011 on U.S. rates of teenage pregnancy, birth and abortion, and on numbers of teenage pregnancies, births, abortions and miscarriages, all by state. It also includes population counts and trends in each state’s teenage pregnancy, birth and abortion rates, as well as abortion ratios, for selected years between 1988 and 2011. The report concludes with a discussion of the methodology and sources used to obtain the estimates.

Reproductive rights are under attack. Will you help us fight back with facts?

Introduction

This report contains the most recent and comprehensive statistics available—for 2011—on U.S. rates of teenage pregnancy, birth and abortion, and on numbers of teenage pregnancies, births, abortions and miscarriages, all by state. It also includes population counts and trends in each state’s teenage pregnancy, birth and abortion rates, as well as abortion ratios, for selected years between 1988 and 2011. The report concludes with a discussion of the methodology and sources used to obtain the estimates. 

Counts of pregnancies include births, legal induced abortions and spontaneous fetal losses (i.e., miscarriages and stillbirths). The estimates we present for 2011 are part of the Guttmacher Institute’s ongoing surveillance of teen pregnancies in the United States. Our state-level teen pregnancy report is updated when new data become available—generally every two years—and contains the most up-to-date estimates of teen pregnancy using counts of births as reported in the National Vital Statistics System1 (via birth certificates) and of abortions from the Guttmacher Institute’s periodic national census of abortion providers. This census is widely recognized as the most accurate count of abortions performed annually in the United States.2

A demographic rate is defined as the number of events (in this case, pregnancies, births or abortions) divided by the number of individuals who could experience the event (the population) multiplied by 1,000. The pregnancy rate is not synonymous with the birthrate. Trends in rates of births and abortions can move in different directions and may be affected by different social and economic factors.

Unless otherwise indicated, this report uses the words "teenagers" and "teens" to refer to women aged 15–19. The report includes numbers, and in some cases rates, shown separately for women aged 14 and younger, 15–17-year-olds, 18–19-year-olds and all women aged 15–19. We also present statistics for 15–19-year-olds by race and ethnicity. The numbers, rates and ratios presented refer to residents of the state.

This report is an update of a previously published report with estimates through 2010.3 Estimates for prior years have changed (see Methodology for explanation) and statistics in this report supersede prior reports. Updated national-level teen pregnancy statistics through 2011 are published separately.4


Key Findings

State levels in 2011 (Tables 1.1–1.2)*

• In 2011, New Mexico had the highest teenage pregnancy rate (72 per 1,000 women); the next highest rates were in Mississippi (70), Arkansas (69), Louisiana (66), Texas (65) and Oklahoma (65). The lowest rates were in New Hampshire (26), Minnesota (31), Vermont (32), Massachusetts (33) and Utah (33).

• In 2011, the teenage birthrate was highest in Mississippi (51 per 1,000 women), and the next highest rates were in Arkansas (50), New Mexico (48), Oklahoma (48) and Texas (47). The lowest rates were in New Hampshire (14), Massachusetts (15), Connecticut (16), Vermont (17) and New Jersey (19).

• Teenage abortion rates in 2011 were highest in New York (30 per 1,000 women), Maryland (23), Hawaii (23), Delaware (23), and New Jersey (22). The lowest rates were found in Utah (4), South Dakota (5), Kansas (5), North Dakota (6), Wisconsin (6), Kentucky (6), Idaho (6), Nebraska (6) and Indiana (6).

• In general, states with the largest numbers of teenagers also had the greatest numbers of teenage pregnancies in 2011. California recorded the highest number of pregnancies among women aged 15–19 (72,180), followed by Texas, New York, Florida and Illinois (22,660–59,570). The states with the smallest numbers of teenage pregnancies (fewer than 1,500 each) were, in ascending order, Vermont, Wyoming, North Dakota, New Hampshire, South Dakota, Maine, Alaska and Montana.

• In three states—New York, New Jersey and Connecticut—more than half of teenage pregnancies (excluding miscarriages and stillbirths) in 2011 ended in abortion (59%, 54% and 51%, respectively).

• In 2011, the states with the lowest proportions of teenage pregnancies ending in abortion (15% or less, in ascending order) were Kentucky, Oklahoma, South Dakota, Kansas, Arkansas, Mississippi, Utah, Texas, and Indiana.

Trends in pregnancy, birth and abortion rates and abortion ratios (Tables 1.3–1.6)

• Between 1988 and 2000, and again between 2000 and 2005, the teenage pregnancy rate declined in every state. However, between 2005 and 2008, the rate decreased in 18 states, stayed the same in five and increased in 27. Then, between 2008 and 2010, the rate once again declined in all 50 states. In the one-year period between 2010 and 2011, the teenage pregnancy rate declined in every state but Vermont, where it remained unchanged.

• Delaware, New Mexico and Texas experienced the largest decreases in the teen pregnancy rate (eight rate-points each) between 2010 and 2011, from 68 to 60 pregnancies per 1,000 women aged 15–19 in Delaware (a 13% decline), 80 to 72 in New Mexico (a 10% decline) and 73 to 65 in Texas (an 11% decline). Rates in Colorado, Connecticut, Mississippi, Nevada, North Carolina and South Carolina all dropped seven points between 2010 and 2011; decreases for 39 other states ranged from one to six points. 

• In 2010–2011, teenage birthrates decreased in every state. The birthrate among teenagers decreased most in Montana (six rate-points), from 35 to 29 births for every 1,000 women aged 15–19. During the period, three other states—Idaho, New Mexico and Texas—experienced decreases in the teenage birth rate of five points.

• Between 2010 and 2011, abortion rates among teens decreased by two or more rate-points in 20 states; teen abortion rates increased by two points in only one state (Vermont) and had little to no change in 29 states.

• Between 2000 and 2011, the teen abortion ratio—i.e., the proportion of teen pregnancies ending in abortion—decreased by at least 5% in 35 states, with Kansas, Oklahoma and Wyoming experiencing decreases greater than 30%. The teen abortion ratio increased by at least 5% in five states (Alaska, Delaware, Georgia, Louisiana and Utah).

State levels by race and ethnicity (Tables 1.7–1.9)

• Many states did not have or could not provide data on the race or ethnicity of teenagers who obtained an abortion. In others, race or ethnicity of the abortion recipient was missing for 20% or more of cases. As a result, we are able to present pregnancy and abortion rates by race and ethnicity for 28 states; findings from these states are highlighted below. For two additional states (Iowa and Louisiana), we calculated estimates by race only, irrespective of Hispanic ethnicity. For two other states (Kentucky and New Mexico), we estimated pregnancy and abortion rates for Hispanic teens, but not for any other racial or ethnic group. For Wisconsin, we estimated rates for white, black and other teens (irrespective of ethnicity) and for Hispanic teens.

• Among states with data available, pregnancy rates for non-Hispanic white teenagers ranged from 20 to 63 pregnancies per 1,000 women aged 15–19. Rates were highest in Southern states: West Virginia (63), Arkansas (60), Oklahoma (57), Tennessee (49), Alabama (46) and South Carolina (46). The lowest rates were found in New Jersey (20), Minnesota (21), Utah (24) and New York (27).

• Pregnancy rates among non-Hispanic black teenagers were highest in New York (122 per 1,000 women aged 15–19), followed by New Jersey (111), Michigan (104), Arkansas (96) and Delaware (96). The lowest rate was in Vermont (30), followed by Utah (37), Maine (39) and Colorado (57).

• Pregnancy rates among non-Hispanic teens of races other than white and black were highest in South Dakota (112 pregnancies per 1,000 women aged 15–19), followed by Oklahoma (61) and Hawaii (59); the lowest pregnancy rates were found in Indiana (10), West Virginia (10), Texas (13) and Tennessee (13).

• Among states with data, pregnancy rates among Hispanic teens were highest in Georgia (95 pregnancies per 1,000 women aged 15–19), South Dakota (94), Kansas (91), Alabama (91) and New York (91). In contrast, pregnancy rates among Hispanic teenagers were low in Vermont, Maine and West Virginia (19, 32 and 36, respectively).


Discussion

This report documents continuation of the long-term decline in rates of pregnancies, births and abortions among teenagers at the state level. Teen pregnancies have declined dramatically in the United States since their peak in the early 1990s, as have the births and abortions that result.4 In 2011, the national teen pregnancy rate reached its lowest level in nearly 40 years, with especially large declines between 2008 and 2011.

Teen pregnancy rates in all 50 states have steadily declined over the past 20 years, and the dramatic decline from 2008 to 2011 in national rates of pregnancies, births and abortions reflects a decline in each of the 50 states. Yet, even with long-term and ongoing declines, substantial disparities between states remain in these rates and in the patterns of pregnancy outcomes (see Figure 1). A number of factors likely contribute to differences between states, including differences in the demographic characteristics of their populations, the availability of comprehensive sex education, knowledge about and availability of contraceptive services, and cultural attitudes toward sexual behavior and childbearing.


It is unlikely that state-level policies alone have led to the declines seen across all states. In fact, the most recent and steepest declines occurred prior to the 288 restrictions on abortion access enacted by state legislatures since 2011.5 Indeed, adolescent pregnancy rates have been declining in a number of Western European countries as well (although trend data for pregnancies, rather than births, are hard to find).6 In many settings, simultaneous declines in pregnancy rates among adolescents and young adults—which reflect later initiation of childbearing among women—suggest that similar causal factors may have influenced both age-groups. Some research suggests that fertility behaviors are affected by economic conditions, especially for teens, and that the recession beginning in 2008 may have played a role in the more recent decline.7 Although there is virtually no evidence of a change in the proportion of teens who are sexually active, there is evidence that contraceptive practices have improved among older teens: According to a recent study, the proportion of 18–19-year-old women who reported using long-acting reversible contraceptive methods tripled between 2007 and 2009,8 and promotion and acceptance of these methods among teens and young adult women has also increased.9,10

Trends in teenage and young adult pregnancy, birth and abortion will need to be closely monitored over the coming years to determine how the reproductive behaviors of young women and men in the United States may be changing. Further research will be needed to understand the behavioral, social and economic factors that are affecting these trends. Specifically, research will need to address not just why fewer teens and young adult women are having births, but also why fewer are becoming pregnant.

Tables

Tables 1.1 – 1.9

About the Tables

Pregnancies are the sum of births, abortions and fetal losses (i.e., miscarriages and stillbirths). Rates are calculated as the number of events per 1,000 women. Abortion ratios represent the number of abortions divided by the sum of abortions and births. Fetal losses are excluded from the denominator because the ratio is intended to represent how women choose to resolve a pregnancy and those ending in miscarriage or stillbirth are considered to be beyond control of the pregnant woman.

In these tables, "age" refers to the woman’s age when the pregnancy ended. Consequently, the actual number of pregnancies that occurred among teenagers was higher than what is reported here because most of the women who conceived at age 19 had their births or abortions after they turned 20 and, thus, were not counted as teenagers. Likewise, "year" refers to the calendar year in which the birth, abortion or fetal loss occurred, not when the conception occurred.

Methodology

The estimates in Tables 1.1–1.7 are based on data from the following sources (exact sources are listed in the Data Sources section):

  • Number of births—National Center for Health Statistics (NCHS)
  • Total number of abortions to residents of each state—Guttmacher Institute and the Centers for Disease Control and Prevention (CDC)
  • Tabulations of abortion data by age and race or ethnicity—state health departments
  • Population estimates—Population Estimates Program of the U.S. Bureau of the Census, in collaboration with NCHS
Births

The numbers of births occurring in each state in each calendar year are obtained from the National Vital Statistics System of the NCHS. The data are based on information abstracted from birth certificates filed in vital statistics offices of each state and the District of Columbia.11 Births are categorized by race and ethnicity of the mother, and include those of unknown ethnicity so as to be comparable with abortion estimates for these groups.

Abortions

The Guttmacher Abortion Provider Censuses (APCs) obtain data from all known U.S. abortion providers and provide the annual numbers of abortions in each state for 1988, 1992, 1996, 2000, 2005, 2008, 2010 and 2011. Starting with the number of abortions performed in each state for women of all ages (residents and nonresidents),12 we reassigned abortions to the woman’s state of residence on the basis of information collected by state abortion reporting agencies. In 2011, this information was compiled by the CDC and made available in a table showing, for each state, the state of residence for each woman who had an abortion in that state.13 The CDC table suppressed any cell with fewer than 50 abortions, so we used the more complete data available from many state health department websites and, where necessary, contacted the states directly for this information. Some states, however, do not collect this information; for these states, we asked a sample of abortion facilities where the women obtaining abortions said they lived.

Of state residents who had an abortion, the proportions who were younger than 15, 15–17 and 18–19 were taken from the CDC Abortion Surveillance report14 or from tabulations provided to us by individual states. For states with incomplete or no information on the age of women who had an abortion in 2011,§ we estimated the proportion of abortions obtained by teenagers by using the national distribution or the distribution from neighboring states (see notes to tables for state-specific calculation methods). As there is a high correlation between a state’s overall abortion rate and the abortion rate among teenagers, this method gives a fair approximation of the number and rate of abortions among teenagers. Finally, we applied a small adjustment factor to the state-specific abortion distributions, so they would sum to previously published national distributions of abortions by age.** Because of a recent adjustment made in these national distributions, we recalculated this adjustment factor for prior years; as a result, estimates for 1988-2010 differ slightly from those previously published.

The CDC does not release data showing the race or ethnic distributions of teenagers having abortions by state; we contacted the state health departments for this information or, in a few states, were able to obtain it from the state’s department of health website. The race and ethnic distributions were then applied to our estimate of the number of abortions obtained by state residents aged 15–19. We made no estimates for states that did not provide the race or ethnicity data or those with a large proportion of abortions with unknown race or ethnicity (i.e., missing for greater than 20% of cases). Three states (Iowa, Louisiana and Wisconsin) provided data for white, black and other teens irrespective of Hispanic ethnicity; for these three states, pregnancies and abortions were calculated for these groups in place of non-Hispanic white, non-Hispanic black and non-Hispanic other. 

Our calculation methods assume that teenagers travel outside their home state for abortion services in the same proportions as do older women. This assumption may not be valid in states with parental involvement requirements or in surrounding states to which teenagers may travel. There is need for further research on the extent to which teens are traveling out of state because of these requirements.

Fetal losses

Accurate estimates of the incidence of pregnancy include those conceptions that do not result in induced abortion or in live birth. The majority of these pregnancies end in spontaneous abortion ("miscarriage"), with smaller numbers ending in stillbirth (most often defined as pregnancy loss after the 20th week of pregnancy) or ectopic pregnancy (implantation of a fertilized ovum outside of the main cavity of the uterus). Stillbirths are generally reported by hospitals in death records; many states do collect miscarriage data, but reporting is incomplete, particularly for miscarriages that occur prior to 20 weeks’ gestation. In fact, many women experience a very early miscarriage without realizing it, perhaps experiencing what they believe are late periods.

We estimate recognized fetal loss as the sum of 20% of births and 10% of abortions. While these proportions are rough approximations for the numbers of recognized fetal losses, it is important to account for the fact that the incidence of fetal loss in a population is dependent upon the ratio of abortions to births. Pregnancies that are terminated by induced abortion are not exposed to the same risk of fetal loss as those that are continued to term; the risk is greatly diminished, especially if the abortion occurs in the early weeks of the pregnancy. In fact, most miscarriages occur by the 14th week of pregnancy,15 and more than 90% of abortions occur before the 14th week of pregnancy.4 In other words, some abortions supersede miscarriages that would have otherwise occurred. In contrast, pregnancies that are carried to term are exposed to the full risk of pregnancy loss. Thus, estimation of fetal loss as a proportion of births and abortions allows us to account for these different gestation-dependent risks associated with pregnancies that end early (abortions) and those that end later (births). Put simply, the more pregnancies terminated by abortion, the less opportunity for a miscarriage to occur and the lower the overall incidence.

Finally, these proportions, 20% and 10%, are intended only as approximations, based on what little data are available on the incidence of fetal loss.16,17 The precise proportions are likely not as important as the recognition that the population level of induced abortion in relation to births affects the estimates of fetal loss considerably.

Because health department abortion statistics are incomplete or nonexistent in some states, care should be used in interpreting the teenage abortion and pregnancy data. For the states with no information on the age of women having abortions, the rate of abortion among teenagers was estimated. Similarly, error is introduced by the assumption that teenagers have abortions out of state in the same proportions as older women. Therefore, one should be cautious in drawing inferences about the effects of parental involvement requirements on the number of abortions obtained by minors.

Other sources of teen pregnancy statistics

The estimates in this report may differ from those found in other sources. First, many state health departments produce estimates of teen pregnancy on the basis of numbers of abortions reported to the department. In some cases, these match those obtained from the Guttmacher APC. In other cases, the APC estimates are higher because they include data from a greater number of providers in the state. Second, our denominators are based on population estimates that are produced by the Census Bureau, in collaboration with NCHS, for July 1 of each year and revised periodically. Hence, our rates may differ slightly from those published elsewhere, depending on which year the population estimates were made (the "vintage" of those estimates) or whether the rates have been updated using the intercensal population estimates available after each national census. We update our rates when the intercensal estimates are released.

Finally, the revised estimates in this report differ from those previously published by the Guttmacher Institute. As described above, in this report, we recalculated estimates for all previous years because of a recalibration of previously published national trends. 

Footnotes

*These observations exclude the District of Columbia, which is more comparable to a city than a state.

And possibly ever; data reach back only to 1972.

California, Florida, Iowa, Louisiana, Maryland, Massachusetts and New Hampshire.

§California, Florida, Maryland, New Hampshire and Wyoming.

**See Kost K and Maddow-Zimet I, U.S. Teenage Pregnancies, Births and Abortions, 2011: National Trends by Age, Race and Ethnicity, New York: Guttmacher Institute, 2016, http://www.guttmacher.org/report/us-teen-pregnancy-trends-2011

References

1. Centers for Disease Control and Prevention (CDC), National Vital Statistics System, http://www.cdc.gov/nchs/nvss.htm.

2. Ventura SJ et al., Estimated pregnancy rates and rates of pregnancy outcomes for the United States, 1990–2008, National Vital Statistics Reports, 2012, Vol. 60, No. 7.

3. Kost K and Henshaw SK, U.S. Teenage Pregnancies, Births and Abortions, 2010: National and State Trends by Age, Race and Ethnicity, 2013, New York: Guttmacher Institute, http://www.guttmacher.org/pubs/USTPtrends10.pdf.

4. Kost K and Maddow-Zimet I, U.S. Teenage Pregnancies, Births and Abortions, 2011: National Trends by Age, Race and Ethnicity, 2016, New York: Guttmacher Institute, http://www.guttmacher.org/report/us-teen-pregnancy-trends-2011.

5. Guttmacher Institute, Last five years account for more than one-quarter of all abortion restrictions enacted since Roe, Jan. 13, 2016, http://www.guttmacher.org/media/inthenews/2016/01/13/index.html.

6. Sedgh G et al., Adolescent pregnancy, birth and abortion rates across countries: levels and recent trends, unpublished report, New York: Guttmacher Institute, 2014.

7. Ananat EO et al., Community-wide job loss and teenage fertility: evidence from North Carolina, Demography, 2013, 50(6):2151–2171.

8. Finer LB, Jerman J and Kavanaugh MK, Changes in use of long-acting contraceptive methods in the United States, 2007–2009, Fertility and Sterility, 2012, 98(4):893–897.

9. Committee on Adolescent Health Care, Long-Acting Reversible Contraception Working Group, Adolescents and long-acting reversible contraception: implants and intrauterine devices, Committee Opinion, 2012, No. 539.

10. CDC, U.S. selected practice recommendations for contraceptive use, 2013: adapted from the World Health Organization Selected Practice Recommendations for Contraceptive Use, 2nd Edition, Morbidity and Mortality Weekly Report, 2013, Vol. 62, No. RR05.

11. National Bureau of Economic Research, NCHS’ Vital Statistics Natality Birth Data: 1968–2014, http://www.nber.org/data/vital-statistics-natality-data.html.

12. Jones RK and Jerman J, Abortion incidence and service availability in the United States, 2011, Perspectives on Sexual and Reproductive Health, 2014, 46(1):3–14.

13. CDC, Abortions distributed by state of maternal residence and state of clinical service, no date, http://www.cdc.gov/reproductivehealth/Data_Stats/Abortion.htm.

14. Pazol K et al., Abortion surveillance—United States, 2011, Morbidity and Mortality Weekly Report, 2014, Vol. 63, No. SS11.

15. Avalos L, Galindo C and Li D, A systematic review to calculate background miscarriage rates using life table analysis, Birth Defects Research (Part A), 2012, 94(6):417–423.

16. Leridon H, Human Fertility: The Basic Components, Chicago: University of Chicago Press, 1977, Table 4.20.

17. Bongaarts J and Potter RE, Fertility, biology, and behavior: An analysis of the proximate determinants, New York: Academic Press, 1983.


Data sources


Population

1988: U.S. Bureau of the Census, U.S. population estimates, by age, sex, race and Hispanic origin: 1980 to 1991, Current Population Reports, 1993, Series P-25, No. 1095, Table 1.

1992, 1996: National Center for Health Statistics (NCHS), Intercensal estimates of the July 1, 1990–July 1, 1999, United States resident population by county, single-year of age, sex, bridged race, and Hispanic origin, file icen_natA1.txt, 2004, http://www.cdc.gov/nchs/nvss/bridged_race.htm.

2000, 2005: NCHS, Intercensal estimates of the July 1, 2000–July 1, 2009 United States resident population by year, county, age, sex, bridged race, and Hispanic origin, file icen_state2000_2009.sas7bdat, Oct. 26, 2012, http://www.cdc.gov/nchs/nvss/bridged_race.htm.

2010: NCHS, Estimates of the April 1, 2010, July 1, 2010–July 1, 2012 United States resident population from the Vintage 2012 postcensal series by year, county, age, sex, bridged race, and Hispanic origin, file pcen_v2012.txt, June 13, 2013, http://www.cdc.gov/nchs/nvss/bridged_race.htm.

2011: NCHS, Estimates of the April 1, 2010, July 1, 2010–July 1, 2014 United States resident population from the Vintage 2014 postcensal series by year, county, age, sex, bridged race, and Hispanic origin, file pcen_v2014_y2014.txt, June 30, 2015, http://www.cdc.gov/nchs/nvss/bridged_race.htm.


Births

1988: National Bureau of Economic Research, NCHS’ vital statistics natality birth data: 1968–2014, http://www.nber.org/data/vital-statistics-natality-data.html.

1992–2011: NCHS, Tables of final births by mother’s age, race and Hispanic ethnicity from the National Vital Statistics System, no date, http://205.207.175.93/VitalStats/ReportFolders/reportFolders.aspx.


Abortions

1988, 1992, 1996, 2000, 2005, 2008, 2010 and 2011: Unpublished data based on the national total number of abortions from the Guttmacher Abortion Provider Surveys, the adjusted age, race, and ethnicity distribution of abortions from the CDC and tabulations of age by race and ethnicity from state health departments.

Suggested Citation

Kost K and Maddow-Zimet I, U.S. Teenage Pregnancies, Births and Abortions, 2011: State Trends by Age, Race and Ethnicity, 2016, New York: Guttmacher Institute, http://www.guttmacher.org/report/us-teen-pregnancy-state-trends-2011.

Acknowledgments

This report was prepared by Kathryn Kost and Isaac Maddow-Zimet, both of the Guttmacher Institute. It was edited by Jared Rosenberg. The authors thank the following Guttmacher Institute colleagues: Alexandra Arpaia, for providing research assistance; and Heather Boonstra, Lawrence Finer and Stanley Henshaw, for providing valuable comments and suggestions. In addition, the authors gratefully acknowledge the numerous state health department staff who provided tabulations of their data. The Guttmacher Institute gratefully acknowledges the general support it receives from individuals and foundations, including major grants from The William and Flora Hewlett Foundation and the David and Lucile Packard Foundation, which undergirds all of the Institute’s work. Additional support was provided by the Guttmacher Center for Population Research Innovation and Dissemination (NIH grant 5 R24 HD074034).

*These observations exclude the District of Columbia, which is more comparable to a city than a state.
†And possibly ever; data reach back only to 1972.
‡California, Florida, Iowa, Louisiana, Maryland, Massachusetts and New Hampshire.
§California, Florida, Maryland, New Hampshire and Wyoming.
**See Kost K and Maddow-Zimet I, U.S. Teenage Pregnancies, Births and Abortions, 2011: National Trends by Age, Race and Ethnicity, New York: Guttmacher Institute, 2016,
http://www.guttmacher.org/sites/default/files/report_downloads/us-teen-….

Topic

United States