U.S. Teenage Pregnancies, Births and Abortions, 2011: National Trends by Age, Race and Ethnicity

This publication has been updated. Please see here for the latest version.

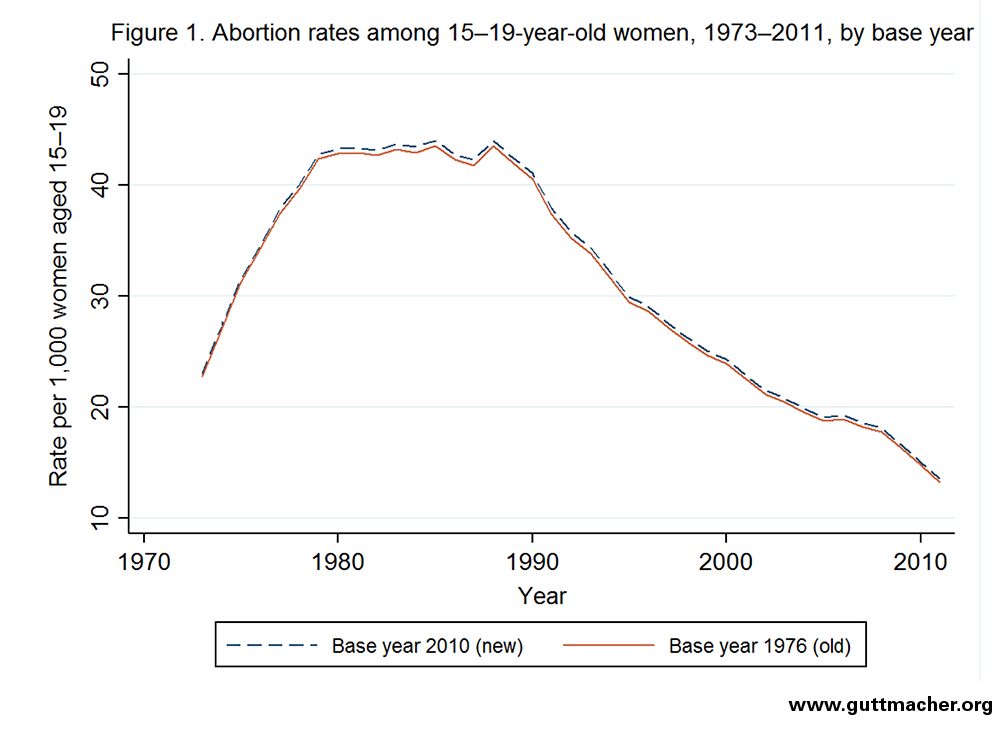
This report contains statistics for 2011 on the incidence of teenage pregnancy, birth and abortion for the United States as a whole, with trends since 1973. The report concludes with a discussion of the methodology and sources used to obtain the estimates.

Reproductive rights are under attack. Will you help us fight back with facts?

Introduction


This report contains the most recent and comprehensive statistics available—for 2011—on the incidence of teenage pregnancy, birth and abortion for the United States as a whole, with trends since 1973. The report concludes with a discussion of the methodology and sources used to obtain the estimates. 

Counts of pregnancies include births, legal induced abortions and spontaneous fetal losses (i.e., miscarriages and stillbirths). The National Center for Health Statistics (NCHS) provides annual counts of teen births in the United States, as reported in the National Vital Statistics System (via birth certificates).1 The estimates we present for 2011 are part of the Guttmacher Institute’s ongoing surveillance of teen pregnancies in the United States. Our national-level teen pregnancy report is updated when new data become available—generally every two years—and contains the most up-to-date estimates of teen pregnancy using counts of births from NCHS and of abortions from the Guttmacher Institute’s periodic national census of abortion providers. This census is widely recognized as the most accurate count of abortions performed annually in the United States.2

A demographic rate is defined as the number of events (in this case, pregnancies, births or abortions) divided by the number of individuals who could experience the event (the population). The pregnancy rate is not synonymous with the birthrate. Trends in rates of births and abortions can move in different directions and may be affected by different social and economic factors.

Unless otherwise indicated, this report uses the words "teenagers" and "teens" to refer to women aged 15–19. The report also includes numbers, and in some cases rates, shown separately for women aged 14 and younger, 15–17-year-olds, 18–19-year-olds, all women younger than 20, and 20–24-year-olds. We also present statistics for 15–19-year-olds by race and ethnicity for the years 1990–2011.

Key Findings

National levels and trends (Tables 1.1–1.6)

• In 2011, some 562,000 women younger than 20 became pregnant. About 553,000 of those pregnancies were among teenagers (i.e., 15–19-year-olds), and nearly 10,000 were among those aged 14 and younger.

• The pregnancy rate among teenagers was 52.4 per 1,000 women; this means that about 5% of teens became pregnant in 2011.

• Although 18–19-year-olds made up 41% of all 15–19-year-old women in 2011, they accounted for 70% of all teen pregnancies. The pregnancy rate among 18–19-year-olds was 89.2, while the rate among 15–17-year-olds was 26.7.

• In 2011, the U.S. teenage pregnancy rate was at its lowest point in more than 30 years and less than half of the peak rate in 1990 (117.6). Between 2008 and 2011 alone, the rate dropped 23% (from 68.2).

• The pregnancy rate among sexually experienced teenagers (i.e., those who had ever had intercourse) was 117.8 per 1,000 women aged 15–19, which reflects the fact that the overall teenage pregnancy rate includes a substantial proportion of young women who have never had sex. The pregnancy rate among sexually experienced teenagers in 2011 was just above half of the 1990 rate of 224.9.

• The teenage birthrate in 2011 was 31.3 per 1,000 women—roughly half of the 1991 rate of 61.8, which was the highest since abortion was legalized in 1973.

• The 2011 teenage abortion rate was 13.5 per 1,000 women, the lowest since abortion was legalized and 69% lower than its peak in 1988 (44.0).

• The long-term declines in teenage birth and abortion rates stalled between 2005 and 2006, but resumed by 2007 and accelerated between 2008 and 2011.

• From 1985 to 2007, the proportion of teenage pregnancies ending in abortion (i.e., the abortion ratio) declined by one-third, from 46% to 31%. This proportion has remained relatively stable since 2007.

Trends by race and ethnicity (Table 1.7)

• Among non-Hispanic white teenagers, the pregnancy rate declined 58% between 1991 and 2011 (from 83.2 per 1,000 to 35.3).

• The pregnancy rate among black teens fell 59% between 1990 and 2011 (from 226.7 per 1,000 to 93.8).

• Among Hispanic teenagers (of any race), the pregnancy rate fell 56% between its peak in 1992 and 2011 (from 166.8 per 1,000 to 73.5). In just three years, from 2008 to 2011, the teen pregnancy rate for Hispanic teens fell 31% (from 105.8 to 73.5).

Disparities by race and ethnicity in 2011 (Table 1.8)

• In 2011, the pregnancy rate among non-Hispanic white teens (35.3) was less than half that among non-Hispanic blacks (92.6) and Hispanics (73.5).

• Wide differences in birth and abortion rates (as opposed to pregnancy rates) also persist across racial and ethnic groups. The birthrate in 2011 for non-Hispanic white teenagers (21.7) was less than half that among non-Hispanic black teenagers (47.2) and Hispanic teenagers (49.6). The abortion rate for non-Hispanic black teenagers (32.6) was almost four times that for non-Hispanic whites (8.5) and more than two and half times that for Hispanics (12.7).

• In 2011, non-Hispanic teens of races other than white or black experienced a similar pregnancy rate as non-Hispanic white teens (33.4 and 35.3, respectively); however, their birthrate was lower than that among whites (16.3 vs. 21.7), and their abortion rate was higher (12.6 vs. 8.5).

Discussion


This report documents continuation of the long-term decline in national rates of pregnancies, births and abortions among teenagers in the United States. Teen pregnancy rates have declined dramatically since their peak in 1990, as have the births and abortions that result. In 2011, the teen pregnancy rate reached its lowest level in nearly 40 years,* with especially large declines from 2008 to 2011.

There was a substantial drop in the teen pregnancy rate for both 15–17- and 18–19-year-olds between 2008 and 2011, yet pregnancies among 18–19-year-olds made up the majority of all teen pregnancies (70% in 2011); as a result, decreases in pregnancies among this age-group were responsible for around three-fifths of the overall decline. Although there is some evidence that the proportion of women aged 18–19 who report having ever had sex increased between 2008 and 2010, there was very little change in the proportion between 2010 and 2012. In other words, both of these trends in sexual activity could contribute to more pregnancies, not fewer as we are finding. Thus, something else must be contributing to decreases in teen pregnancy, and it appears likely that recent changes in contraceptive use are driving the reduction. There is evidence that contraceptive practices have improved among older teens: A recent study found that the proportion of 18–19-year-old women who report using long-acting reversible contraceptive methods tripled between 2007 and 2009,3 and promotion and acceptance of these methods among teens and young adult women has increased.4,5 Contraceptive use is also likely to be associated with the large decline in the pregnancy rate among sexually experienced teens. 

It is important to recognize that declines in the rate of teen births do not necessarily result in lower pregnancy rates. In theory, if abortion rates increase, the pregnancy rate could remain constant even while birthrates fall. In other words, teens who become pregnant could be increasingly likely to have an abortion, rather than a birth. This report demonstrates that, in fact, fewer teens became pregnant in 2011 than at any time since tracking of these data began, which reflects our finding that both birth and abortion rates among teens have steadily declined.

In 2011, birthrates and abortion rates among teenagers and young adult women reached historic lows. From 2008 to 2011, pregnancy rates dropped 23% among women aged 15–19 and 16% among those aged 20–24.

Recent data on births from the NCHS show that birthrates among teens have continued to decline—dropping another 10% between 2012 and 2013.6 Abortion data are not yet available for these most recent years, so we cannot calculate teen pregnancy rates; however, increases in abortion are not expected, given longstanding declines in abortion rates over the past three decades.7

The data presented here indicate that even with the recent reductions in rates of teenage pregnancies, births and abortions, there are still persistently large and long-standing disparities by race and ethnicity. These mirror disparities in unintended pregnancy rates found among all U.S. women of reproductive age, which are several times higher among women of color than among whites.8

Although trend data for pregnancies—rather than births—are hard to find, adolescent pregnancy rates have been declining in a number of Western European countries, as well as in the United States.9 In many settings, simultaneous declines in pregnancy rates among adolescents and young adults—reflecting later initiation of childbearing among women—suggest that similar causal factors may have influenced both age-groups. It is still unclear, however, precisely why these declines are occurring. Some research suggests that fertility behaviors are affected by economic conditions, especially for teens, and that the recession beginning in 2008 may have played a role in the more recent decline.10

Trends in teenage and young adult pregnancy, birth and abortion will need to be closely monitored over the coming years to determine how the reproductive behaviors of young women and young men in the United States may be changing. Further research will be needed to understand the behavioral, social and economic factors that are affecting these trends. Specifically, research will need to address not just why fewer teens and young adult women are having births, but also why fewer are becoming pregnant.

Tables


Tables 1.1 – 1.8

About the Tables


Pregnancies are the sum of births, abortions and fetal losses (i.e., miscarriages and stillbirths). Rates are calculated as the number of events per 1,000 women. Abortion ratios are the number of abortions divided by the sum of abortions and births. Fetal losses are excluded from the denominator because the ratio is intended to represent how women choose to resolve a pregnancy and those ending in miscarriage or stillbirth are considered to be beyond control of the pregnant woman.

In these tables, "age" refers to the woman’s age when the pregnancy ended. Consequently, the actual number of pregnancies that occurred among teenagers is higher than what is reported here because most of the women who conceived at age 19 had their births or abortions after they turned 20 and, thus, were not counted as teenagers. Likewise, "year" refers to the calendar year in which the birth, abortion or fetal loss occurred, not when the conception occurred.

Methodology


The estimates in Tables 1.1–1.7 are based on data from the following sources (detailed below in the Data Sources section):

  • Number of births—National Center for Health Statistics (NCHS) vital statistics
  • Number of abortions—Guttmacher Institute’s Abortion Provider Census
  • Number of fetal losses (stillbirth, miscarriage, ectopic pregnancies)—estimated as a proportion of births and of abortions
  • Distribution of abortions by age and race or ethnicity—U.S. Centers for Disease Control and Prevention (CDC) surveillance reports
  • Population of women—Population Estimates Program of the U.S. Bureau of the Census, in collaboration with NCHS
Births

The numbers of births occurring in the United States in each calendar year are obtained from NCHS’s National Vital Statistics System. The data are based on information abstracted from birth certificates filed in vital statistics offices of each state and the District of Columbia.11

Abortions

The number of abortions performed each year in the United States is derived from the Guttmacher Institute’s periodic surveys of all identifiable abortion providers. The institute’s first six abortion provider surveys were conducted annually between 1974 and 1979, with each gathering data for the preceding year (1973 through 1978). Surveys were subsequently conducted in 1981, 1983, 1986 and 1989, with each gathering data for the preceding two years. Subsequent surveys were carried out in 1993, collecting data for 1991 and 1992; in 1997 (data for 1995 and 1996); in 2001–2002 (data for 1999 and 2000); in 2006–2007 (data for 2004 and 2005); in 2010–2011 (data for 2007 and 2008); and in 2012–2013 (data for 2010 and 2011; see Data Sources for further detail). Data were not collected for 1983, 1986, 1989, 1990, 1993, 1994, 1997, 1998, 2001, 2002, 2003, 2006 or 2009. Estimates for these years are obtained by linear interpolation using estimates for adjacent years. Estimates in this report include only reported legal abortions. There is evidence that illegal abortions were performed for some time after the U.S. Supreme Court effectively legalized the procedure in 1973,12 but we do not have accurate records or estimates of the number. Thus, our estimates of teen pregnancy in the early-to-mid-1970s may be underestimated.

While the total counts of abortions occurring each year in the United States are obtained from the Institute’s provider censuses, the numbers occurring to each age-group are obtained using data on the characteristics of abortion patients from CDC annual surveillance reports. For each year since 1969, the CDC has compiled abortion data provided voluntarily by state health departments, most of which maintain an abortion reporting system similar to the system of reporting births on birth certificates. However, not all states require the reporting of abortions from providers, and states that do have reporting systems differ in the completeness of reporting, the types of providers that must report and the information obtained on the abortion certificate. In addition, not all states that collect abortion data report the results to the CDC every year, and the data on age and other characteristics sometimes have an unacceptable level of missing data.

To ensure that our estimates do not reflect the year-to-year fluctuations in which states report to the CDC or in the quality or completeness of data reported rather than true changes in the distributions of the characteristics of women obtaining abortions, we use a methodology developed several decades ago by Guttmacher Institute research staff. This methodology calculates yearly changes using only data from those states that are comparable to the previous year, and then applies these changes to an ongoing historical trend anchored by a "base" year. We consider states to be comparable if they reported data on abortions by age to the CDC in both years, if there was no more than a 4% change in the percentage of abortions for which the age of the woman was unknown and if the population of women for which abortion information by age was collected (residents of the state, for example) was comparable between years. A parallel methodology was used to obtain comparable estimates of abortions by race and ethnicity over time.

In prior versions of this report, we used a base year of 1976; the base year for estimates by race and ethnicity was 1990 (the earliest year for which reliable data on these subgroups were available). In the current report, we reset the base year for all trends to 2010, and recalculated estimates for all years prior to 2011 using this new reference year as an anchor. The effect of the recalibration on our estimates was small (see Appendix Figure 1), but as a result, statistics from this report differ slightly from those in earlier reports for this and other reasons (as detailed further below).


To obtain the numbers of abortions among teens in each racial and ethnic group, we rely on tables published by the CDC on the national distribution of abortions by age and race. For years 1990–2000, the CDC publications combined black and other races in these tables. Our calculations for 1990–2000, therefore, assume that the distributions of abortions by age are the same for these two subgroups. Tables for age by Hispanic ethnicity became available only in 1991. Furthermore, until recently, the CDC surveillance report did not include abortion estimates by age, and combined race and ethnicity. To obtain estimates of abortions to non-Hispanic white women prior to 2011, we assumed that the proportion of abortions to Hispanic women who are white was equal to the proportion of births to Hispanic women who are not white. We then subtracted these from the total number of abortions to white women to arrive at estimates of abortions to non-Hispanic white women. The number of states reporting abortions by women’s age combined with both race and ethnicity has increased in recent years, which has increased our confidence in the stability of these estimates. Thus, we began using the CDC combined tables for calculating abortion estimates for non-Hispanic white, non-Hispanic black and non-Hispanic other teens as of 2011 (see Tables 1.7 and 1.8).

Fetal losses

Accurate estimates of the incidence of pregnancy include those conceptions that do not result in induced abortion or live birth. The majority of these pregnancies end in spontaneous abortion ("miscarriage"), while smaller numbers end in stillbirth (most often defined as pregnancy loss after the 20th week of pregnancy) or ectopic pregnancy (implantation of a fertilized ovum outside of the main uterine cavity). Stillbirths are generally reported by hospitals in death records. Many states do collect miscarriage data, but reporting is incomplete particularly for miscarriages that occur prior to 20 weeks gestation. In fact, many women experience a very early miscarriage without realizing it, perhaps experiencing what they believe are late periods.

In this and prior Guttmacher reports of teen pregnancy, we estimate recognized fetal loss as the sum of a proportion of births (20%) and of abortions (10%). While these proportions are rough approximations for the numbers of recognized fetal losses, it is important to account for the fact that the incidence of fetal loss in a population is dependent upon the ratio of abortions to births. Pregnancies that are terminated by induced abortion are not exposed to the same risk of fetal loss as pregnancies that are continued to term; the risk is greatly diminished, especially if the abortion occurs in the early weeks of the pregnancy. In fact, most miscarriages occur by the 14th week of pregnancy,13 and more than 90% of abortions occur before that time.14 In other words, some abortions supersede miscarriages that would have otherwise occurred. In contrast, pregnancies that are carried to term are exposed to the full risk of pregnancy loss. Thus, estimation of fetal loss as a proportion of births and abortions allows us to account for these different gestation-dependent risks associated with pregnancies that end early (abortions) and those that end later (births). Put simply, the more pregnancies terminated by abortion, the less opportunity for a miscarriage to occur and the lower the overall incidence.

It is possible to obtain other estimates of fetal loss. In particular, NCHS pregnancy statistics use the nationally representative National Survey of Family Growth (NSFG) to estimate national-level incidence of recognized fetal loss from women’s reports of pregnancy loss. However, these estimates are obtained for a specific period of time — covering from five to seven years prior to the year of the survey. In this report, we calculate annual rates over a 40-plus year time period. Instead of using rates for a particular period, we use an approximation—20% of births and 10% of abortions—so that the estimation of fetal loss is sensitive to changes in the relative distribution of births and abortions over this longer period. Again, this is important because in times when the abortion rates are high, relatively fewer fetal losses can occur. Failure to account for changes in the relative distribution of births and abortions would mean that the incidence of fetal losses could be over- or underestimated, as would be the overall pregnancy rates.

Finally, the selection of these proportions—20% and 10%—are intended only as approximations based on what little data is available on the incidence of fetal loss.15,16 The precise proportions are likely not as important as the recognition that the population level of induced abortion in relation to births affects the estimates of fetal loss considerably.

Sexually experienced teens

We applied the percentage of teens ever having had sexual intercourse to population totals of 15–19-year-old women in each year to calculate the number who were sexually experienced. The number serves as the denominator for our teen pregnancy rates among sexually experienced teens. The percentage of 15–19-year-old women who were sexually experienced for the years 1982 and 1988 was obtained from the 1982 and 1988 rounds of the NSFG. Linear interpolation was used to calculate the percentages for the intervening years shown in Table 1.1 (1986 and 1987). In the 1982 NSFG, "sexually experienced" was defined as having ever had sex after menarche. For the percentage of sexually experienced 15–19-year-olds for 1988–2002, we obtained the proportions of all 15–19-year-olds who had ever had sexual intercourse in analyses of the 1988, 1995, 2002 and 2006–2008 NSFG. From 1988 on, "sexually experienced" is defined as having ever had sex, regardless of whether it occurred before or after menarche. Linear interpolation was used to calculate the percentages for the intervening years (1989–1994, 1996–2001 and 2003–2005). For the proportion sexually experienced in 2009 and 2010, we used data from respondents who were interviewed in the second half of the 2006–2010 NSFG interview period (from late 2008 through 2010, and applying the corresponding weights provided in the NSFG). For 2011, we obtained the proportion of teens having ever had sex from the 2011–2013 NSFG.

Other sources of teen pregnancy statistics

The estimates in this report may differ from those found in other sources. First, the NCHS and Finer and Zolna estimate fetal loss as a proportion of births from survey respondents' reports of their births and fetal losses in the five or seven years preceding the fielding of each round of the NSFG.17,18 Second, the denominator we used in calculating rates among women younger than 15 is the female population aged 14, because most pregnancies occurring among these very young teenagers are likely among 14-year-olds (this was true for 82% of births in 2011). The NCHS and Finer and Zolna estimates use number of women aged 10–14 for the denominator. We use the number of women aged 15–19 in the denominator for rates among all women younger than 20 because from 1973–2011, nearly all (98–99%) pregnancies to women younger than 20 were among those aged 15–19. Finally, our denominators are based on population estimates that are produced by the Census Bureau, in collaboration with NCHS, for July 1 of each year and revised periodically. Hence, our rates may differ slightly from those published elsewhere, depending on which year the population estimates were made (the "vintage" of those estimates) or whether the rates have been updated using the intercensal population estimates available after each national census. We update our rates when the intercensal estimates are released. For the years 1980, 1990, 2000 and 2010, NCHS uses the April 1 census counts, and we use the July 1 estimates for these and all years.

Finally, the revised estimates in this report differ from those previously published by the Guttmacher Institute. As described above, in this report we recalculated estimates for all previous years with a new base year of 2010. In some cases, we were unable to locate the original source data and were, therefore, unable reproduce estimates published in prior publications (e.g. pregnancy rates for 15–19-year-old Hispanic and non-Hispanic white women in 1990).

Footnotes

*And possibly ever in the history of the United States; data reach back only to 1973.

In 2006–2008, 61% of women aged 18–19 reported having ever had sex, compared with 67% in 2008–2010 and 65% in 2011–2013 (tabulations from the 2006–2010 and 2011–2013 National Survey of Family Growth).

References

1. Centers for Disease Control and Prevention (CDC), National Vital Statistics System, http://www.cdc.gov/nchs/nvss.htm.

2. Pazol K et al., Abortion surveillance—United States, 2011, Morbidity and Mortality Weekly Report, 2014, Vol. 63, No. SS11.

3. Finer LB, Jerman J and Kavanaugh MK, Changes in use of long-acting contraceptive methods in the United States, 2007–2009, Fertility and Sterility, 2012, 98(4):893–897.

4. Committee on Adolescent Health Care, Long-Acting Reversible Contraception Working Group, Adolescents and long-acting reversible contraception: implants and intrauterine devices, Committee Opinion, 2012, No. 539.

5. CDC, U.S. selected practice recommendations for contraceptive use, 2013: adapted from the World Health Organization Selected Practice Recommendations for Contraceptive Use, 2nd Edition, Morbidity and Mortality Weekly Report, 2013, Vol. 62, No. RR05.

6. Martin JA et al., Births: final data for 2013, National Vital Statistics Report, 2015, Vol. 64, No. 1.

7. Jones RK and Jerman J, Abortion incidence and service availability in the United States, 2011, Perspectives on Sexual and Reproductive Health, 2014, 46(1):3–14.

8. Finer LB and Zolna MR, Shifts in intended and unintended pregnancies in the United States, 2001–2008, American Journal of Public Health, 2014, 104(Suppl. 1):S43–48.

9. Sedgh G et al., Adolescent pregnancy, birth and abortion rates across countries: levels and recent trends, unpublished report, New York: Guttmacher Institute, 2014.

10. Ananat EO et al., Community-wide job loss and teenage fertility: evidence from North Carolina, Demography, 2013, 50(6):2151–2171.

11. National Bureau of Economic Research, NCHS’ Vital Statistics Natality Birth Data: 1968–2014, http://www.nber.org/data/vital-statistics-natality-data.html.

12. Centers for Disease Control and Prevention (CDC), Abortion Surveillance, Annual Summary 1973, Atlanta, CDC, 1975.

13. Avalos L, Galindo C and Li D, A systematic review to calculate background miscarriage rates using life table analysis, Birth Defects Research (Part A), 2012, 94(6):417–423.

14. Pazol K et al., Abortion surveillance—United States, 2011, Morbidity and Mortality Weekly Report, 2014, Vol. 63, No. SS11.  

15. Leridon H, Human Fertility: The Basic Components, Chicago: University of Chicago Press, 1977, Table 4.20.

16. Bongaarts J and Potter RE, Fertility, Biology, and Behavior: An Analysis of the Proximate Determinants, New York: Academic Press, 1983.

17. Ventura SJ et al., Estimated pregnancy rates by outcome for the United States, 1990–2004, National Vital Statistics Reports, 2008, Vol. 56, No. 15.

18. Finer LB and Zolna MR, Declines in Unintended Pregnancy in the United States, 2008–2011, New England Journal of Medicine, 2016, 374(9):843–852, http://nejm.org/doi/full/10.1056/NEJMsa1506575.

Data sources


Population

1973-1989: National Cancer Institute, Survey of Epidemiology and End Results (SEER) U.S. State and County Population Data, http://www.nber.org/data/seer_u.s._county_population_data.html.

1990–1999: National Center for Health Statistics (NCHS), Intercensal estimates of the July 1, 1990–July 1, 1999, United States resident population by county, single-year of age, sex, bridged race, and Hispanic origin, file icen_natA1.txt, 2004, http://www.cdc.gov/nchs/nvss/bridged_race.htm.

2000–2009: NCHS, Intercensal estimates of the July 1, 2000–July 1, 2009 United States resident population by year, county, age, sex, bridged race, and Hispanic origin, file icen_state2000_2009.sas7bdat, Oct. 26, 2012, http://www.cdc.gov/nchs/nvss/bridged_race.htm.

2010-20111: NCHS, Estimates of the April 1, 2010, July 1, 2010–July 1, 2014 United States resident population from the Vintage 2014 postcensal series by year, county, age, sex, bridged race, and Hispanic origin, file pcen_v2014.txt, June 30, 2015, http://www.cdc.gov/nchs/nvss/bridged_race.htm.


Births

1973-1989: National Bureau of Economic Research, NCHS’ vital statistics natality birth data: 1968–2014, http://www.nber.org/data/vital-statistics-natality-data.html.

1990-2011: NCHS, Tables of final births by mother’s age, race and Hispanic ethnicity from the National Vital Statistics System, http://205.207.175.93/VitalStats/ReportFolders/reportFolders.aspx.


Abortions

1972: CDC, Abortion Surveillance: 1972, Atlanta: CDC, 1974.

1973–1988: Henshaw SK and Van Vort J, eds., Abortion Factbook, New York: The Alan Guttmacher Institute, 1992, Table 1, p. 172.

1989–2011: Unpublished data based on the national total number of abortions from the Guttmacher Abortion Provider Surveys; Guttmacher estimates for nonsurvey years (1989, 1990, 1993, 1994, 1997, 1998, 2001, 2002, 2003, 2006, 2009); and the adjusted age, race and ethnicity distribution of abortions from the CDC.


Sexually experienced women

NCHS, Public use data tape documentation, National Survey of Family Growth, Cycle III 1982. Hyattsville, MD, 1986.

NCHS, Public use data tape documentation, National Survey of Family Growth, Cycle IV 1988. Hyattsville, MD, 1990.

NCHS, Public use data file documentation, National Survey of Family Growth Cycle 5: 1995, Users Guide. Hyattsville, MD, 1997.

NCHS, Public use data file documentation, National Survey of Family Growth Cycle 6: 2002, Users Guide. Hyattsville, MD, 2004.

NCHS, Public use data file documentation, 2006-2010 National Survey of Family Growth, Users Guide. Hyattsville, MD, 2011.

NCHS, Public use data file documentation, 2011-2013 National Survey of Family Growth, Users Guide. Hyattsville, MD, 2014.

Suggested Citation

Kost K and Maddow-Zimet I, U.S. Teenage Pregnancies, Births and Abortions, 2011: National Trends by Age, Race and Ethnicity, New York: Guttmacher Institute, 2016, http://www.guttmacher.org/report/us-teen-pregnancy-trends-2011

Acknowledgments

This report was prepared by Kathryn Kost and Isaac Maddow-Zimet—both of the Guttmacher Institute. It was edited by Jared Rosenberg. Alexandra Arpaia provided research assistance, and Heather Boonstra, Lawrence Finer and Stanley Henshaw provided valuable comments and suggestions. The Guttmacher Institute gratefully acknowledges the general support it receives from individuals and foundations—including major grants from The William and Flora Hewlett Foundation and the David and Lucile Packard Foundation—which undergirds all of the Institute’s work. Additional support was provided by the Guttmacher Center for Population Research Innovation and Dissemination (NIH grant 5 R24 HD074034).

And possibly ever in the history of the United States; data reach back only to 1973.
In 2006–2008, 61% of women aged 18–19 reported having ever had sex, compared with 67% in 2008–2010 and 65% in 2011–2013 (tabulations from the 2006–2010 and 2011–2013 National Survey of Family Growth).

1. Centers for Disease Control and Prevention (CDC), National Vital Statistics System, http://www.cdc.gov/nchs/nvss.htm.

2. Pazol K et al., Abortion surveillance—United States, 2011, Morbidity and Mortality Weekly Report, 2014, Vol. 63, No. SS11.

3. Finer LB, Jerman J and Kavanaugh MK, Changes in use of long-acting contraceptive methods in the United States, 2007–2009, Fertility and Sterility, 2012, 98(4):893–897.

4. Committee on Adolescent Health Care, Long-Acting Reversible Contraception Working Group, Adolescents and long-acting reversible contraception: implants and intrauterine devices, Committee Opinion, 2012, No. 539.

5. CDC, U.S. selected practice recommendations for contraceptive use, 2013: adapted from the World Health Organization Selected Practice Recommendations for Contraceptive Use, 2nd Edition, Morbidity and Mortality Weekly Report, 2013, Vol. 62, No. RR05.

6. Martin JA et al., Births: final data for 2013, National Vital Statistics Report, 2015, Vol. 64, No. 1.

7. Jones RK and Jerman J, Abortion incidence and service availability in the United States, 2011, Perspectives on Sexual and Reproductive Health, 2014, 46(1):3–14.

8. Finer LB and Zolna MR, Shifts in intended and unintended pregnancies in the United States, 2001–2008, American Journal of Public Health, 2014, 104(Suppl. 1):S43–48.

9. Sedgh G et al., Adolescent pregnancy, birth and abortion rates across countries: levels and recent trends, unpublished report, New York: Guttmacher Institute, 2014.

10. Ananat EO et al., Community-wide job loss and teenage fertility: evidence from North Carolina, Demography, 2013, 50(6):2151–2171.

11. National Bureau of Economic Research, NCHS’ Vital Statistics Natality Birth Data: 1968–2014, http://www.nber.org/data/vital-statistics-natality-data.html.

12. Centers for Disease Control and Prevention (CDC), Abortion Surveillance, Annual Summary 1973, Atlanta, CDC, 1975.

13. Avalos L, Galindo C and Li D, A systematic review to calculate background miscarriage rates using life table analysis, Birth Defects Research (Part A), 2012, 94(6):417–423.

14. Pazol K et al., Abortion surveillance—United States, 2011, Morbidity and Mortality Weekly Report, 2014, Vol. 63, No. SS11.  

15. Leridon H, Human Fertility: The Basic Components, Chicago: University of Chicago Press, 1977, Table 4.20.

16. Bongaarts J and Potter RE, Fertility, Biology, and Behavior: An Analysis of the Proximate Determinants, New York: Academic Press, 1983.

17. Ventura SJ et al., Estimated pregnancy rates by outcome for the United States, 1990–2004, National Vital Statistics Reports, 2008, Vol. 56, No. 15.

18. Finer LB and Zolna MR, Declines in Unintended Pregnancy in the United States, 2008–2011, New England Journal of Medicine, 2016, 374(9):843–852, http://nejm.org/doi/full/10.1056/NEJMsa1506575.

Topic

United States