This report contains statistics for 2013 on the incidence of pregnancy, birth and abortion among adolescents and young women aged 24 or younger for the United States as a whole and for individual states. National data include trends for multiple age-groups since 1973, and state data include trends among 15–19-year-olds since 1988. The report concludes with a discussion of the methodology and sources used to obtain the estimates.
Pregnancies, Births and Abortions Among Adolescents and Young Women in the United States, 2013: National and State Trends by Age, Race and Ethnicity

Reproductive rights are under attack. Will you help us fight back with facts?
Introduction
This report contains comprehensive statistics on the incidence of pregnancy, birth and abortion among women aged 24 or younger for the United States as a whole and for individual states in 2013, the most recent year for which data are available. At the national level, we show trends for multiple age-groups since 1973. For states, we present trends among 15–19-year-olds since 1988. The report concludes with a discussion of the methodology and sources used to obtain the estimates. Our previous statistics for national- and state-level estimates through 2011 were published in two separate reports.1,2
The estimates we present for 2013 are part of the Guttmacher Institute’s ongoing surveillance of pregnancies in the United States. Our report is updated when new data become available—every year or two—and contains the most up-to-date estimates of pregnancy among women aged 24 and younger, including the only available estimates of pregnancy among women in that age range that can be compared across all 50 states.
Counts of pregnancies include births, legal induced abortions and spontaneous fetal losses (i.e., miscarriages and stillbirths). The National Center for Health Statistics (NCHS) provides annual counts of births in the United States, as reported in the National Vital Statistics System (via birth certificates).3 Counts of abortions come from the Guttmacher Institute’s periodic national census of abortion providers. This census is widely recognized as the most accurate count of abortions performed annually in the United States.4 Counts of spontaneous fetal losses are estimated as a proportion of births and abortions (see Methodology section).
A demographic rate is defined as the number of events (in this case, pregnancies, births or abortions) divided by the number of individuals who could experience the event (the population). The pregnancy rate is not synonymous with the birthrate. Trends in rates of births and abortions—two components of the pregnancy rate—can move in different directions, differentially impacting the pregnancy rate, and may be affected by different social and economic factors.
This report includes numbers, and in some cases rates, shown separately for women aged 14 and younger (national-level only), 15–17-year-olds, 18–19-year-olds, 15–19-year-olds, all women younger than 20, and 20–24-year-olds (national-level only). We also present statistics for women aged 15–19 by race and ethnicity. For state-level estimates, the numbers, rates and ratios presented refer to events among residents of the state.
As a record of historical estimates, this report does not include estimates for non-Hispanic black women and non-Hispanic women of other races in earlier years because of data limitations at that time. Statistics for black women regardless of ethnicity are available for 1973 to 2013; statistics for non-Hispanic black women and non-Hispanic women of other races are only available starting from 2011.
This report continues the documentation of four decades of statistics on total pregnancy incidence among young women in the United States. But, it should not be assumed that the total pregnancy rate is synonymous with the unintended pregnancy rate. A new feature in this report is the calculation of state-level unintended pregnancy rates among women younger than 20 in each state for which data were available (31 states). At the time of this report, no national-level data on unintended pregnancy for women younger than 20 were available for 2013.
Pregnancies that occurred when a woman did not want to have a baby (either at that time or in the future) are considered "unintended" pregnancies. Among those that were not unintended, some were wanted at the time they occurred or had been wanted at an earlier point in time ("intended" pregnancies); for a significant proportion of these pregnancies to women younger than 20, the woman recalled having felt unsure about whether she wanted to become pregnant before its occurrence.
Below, we present key findings from the national and state tables in this report. Next, we discuss these findings using graphics that highlight trends over time and geographical variation. Finally, we discuss conclusions related to the findings in the context of other recent research on adolescents. A full discussion of the methods and data sources used for this report follows the tables.
Key Findings
National levels and trends in pregnancy, birth and abortion (Tables 1.1–1.6)
• In 2013, 456,000 women younger than 20 became pregnant. Some 448,000 of those pregnancies were among 15–19-year-olds, and 7,400 were among those aged 14 and younger.
• The pregnancy rate among 15–19-year-olds was 43 per 1,000 women; this means that fewer than 5% of 15–19-year-olds became pregnant in 2013.
• Although 18–19-year-olds made up 41% of all women aged 15–19 in 2013, they accounted for 72% of all pregnancies in this age-group. The pregnancy rate among 18–19-year-olds was 76 per 1,000 women, while the rate among 15–17-year-olds was 21, and the rate was 4 among those aged 14 or younger.
• In 2013, the U.S. pregnancy rate among 15–19-year-olds was at its lowest point in at least 80 years and had dropped to just above one-third of a recent peak rate in 1990 (118 per 1,000 women). Between 2008 and 2013, the rate dropped 36% (from 68 to 43).
• Trends in the pregnancy rate among women aged 14 or younger, 15–17 and 18–19 generally mirror the pattern of decline among 15–19-year-olds. Rates for all four age-groups are at their lowest levels since their peaks in the early 1990s.
• The pregnancy rate among sexually experienced 15–19-year-olds (i.e., those who had ever had intercourse) in 2013 was 101 per 1,000 women. This is more than twice the pregnancy rate among all 15–19-year-olds, a substantial proportion of whom have never had sex. The rate among the sexually experienced was less than half of the 1990 rate of 225.
• The birthrate among 15–19-year-olds in 2013 was 26 per 1,000 women—less than half of the 1991 rate of 62.
• The 2013 abortion rate among 15–19-year-olds was 11 per 1,000 women, the lowest since abortion was legalized and just 24% of the peak rate in 1988 (44).
• The long-term declines in birth and abortion rates among 15–19-year-olds stalled briefly in 2005 and 2006, but resumed in 2007 and accelerated between 2008 and 2013.
• The pregnancy rate among women aged 20–24 in 2013 was 127; this is the lowest annual rate since 1973 (the earliest year for which we have complete data).
• In 2013, the proportion of pregnancies among 15–19-year-olds ending in abortion (i.e., the abortion ratio) was 29%. The abortion ratio differed by age-group: 52% among women aged 14 and younger, 31% among 15–17 year-olds, 28% among 18–19-year-olds and 26% among 20–24-year-olds.
• From 1985 to 2013, the abortion ratio among women aged 15–19 declined by more than one-third, from 46% to 29%.
National trends in pregnancy rates by race, ethnicity and race/ethnicity (Table 1.7)
• The relative declines in pregnancy rates between 1991 and 2013 among women aged 15–19 were similar across black, non-Hispanic white and Hispanic groups: The rate fell 66% among black women aged 15–19 (from 226 per 1,000 women to 76), and 64% among both non-Hispanic white women aged 15–19 (from 83 to 30) and Hispanic women aged 15–19 (from 166 to 61).
• In just six years, from 2007 to 2013, the pregnancy rate for Hispanic 15–19-year-olds fell 47% (from 114 per 1,000 women to 61); over the same time period, there was a drop of 33% among non-Hispanic whites (from 44 to 30) and a 38% decline among blacks (from 122 to 76).
• Recently available data allow us to examine rates by race and ethnicity combined for more groups (see Methodology section). In 2013, the pregnancy rate among non-Hispanic black 15–19-year-olds was 75 per 1,000 women and the rate was 28 among non-Hispanic 15–19-year-olds of other races.*
• Wide differences in birth and abortion rates also persist across racial and ethnic groups. The birthrate in 2013 for non-Hispanic black women aged 15–19 (39 per 1,000 women) and for Hispanic women of the same age (42) was more than twice the birthrate among non-Hispanic white women aged 15–19 (19). The abortion rate for non-Hispanic black 15–19-year-olds (26) was almost four times higher than for non-Hispanic whites (7) and more than two and a half times the rate for Hispanics (10).
• In 2013, non-Hispanic women aged 15–19 of races other than white or black experienced a similar pregnancy rate as non-Hispanic white women in that age-group (28 and 30, respectively); however, their birthrate was lower than that among white women (14 vs. 19), and their abortion rate was higher (11 vs. 7).
State trends in pregnancy, birth and abortion rates and abortion ratios (Tables 2.1–2.4)†
• Between 1988 and 2000, and again between 2000 and 2005, the pregnancy rate among 15–19-year-old women declined in every state. However, between 2005 and 2008, the rate decreased in 18 states, stayed the same in five and increased in 27. Then, between 2008 and 2013, the pregnancy rate once again declined in all 50 states.
• Between 2011 (the most recent year included in the last update of this report) and 2013, the pregnancy rate among women aged 15–19 declined by at least 11% in every state. In 14 states, rates declined by 20% or more: Hawaii (27%), Massachusetts (25%), Maryland (24%), Rhode Island (24%), New Jersey (23%), Connecticut (22%), Delaware (22%), New York (22%), Colorado (21%), Nevada (21%), Washington (21%), Alaska (20%), Georgia (20%) and Wyoming (20%).
• Hawaii experienced the largest absolute decrease in the pregnancy rate (17 rate points) between 2011 and 2013, from 61 to 44 pregnancies per 1,000 women aged 15–19. Other states with large rate point declines were Delaware (14 rate points, from 60 to 46), Maryland (13 points, from 55 to 42), Nevada (13 points, from 62 to 49) and New York (13 points, from 58 to 45). Rates in Alabama, Alaska, Arkansas, California, Colorado, Florida, Georgia, Louisiana, Mississippi, New Jersey, New Mexico, South Carolina, Washington and Wyoming all dropped 10–12 rate points between 2011 and 2013; decreases for 31 other states ranged from four to nine rate points.
• Between 2011 and 2013, birthrates among 15–19-year-old women decreased in every state. Five states had declines of 20% or more in birthrates among 15–19-year-old women: Connecticut (20%), Georgia (20%), Maryland (21%), Massachusetts (21%) and New Jersey (20%). Only one state, Montana, experienced a decline of less than 9% in this period, with a birthrate in 2013 about 5% lower than the rate in 2011.
• The birthrate decreased most between 2011 and 2013 in Mississippi (nine rate points), from 51 to 42 births for every 1,000 women aged 15–19. During that period, four other states—Alabama, Arkansas, Georgia and South Carolina—experienced decreases in the birthrate of seven to eight points.
• Between 2011 and 2013, abortion rates among 15–19-year-old women decreased by 20% or more in 34 states. In 11 states, rates decreased by 30% or more: West Virginia (47%), Hawaii (43%), Wyoming (39%), Iowa (37%), Louisiana (34%), Nevada (33%), Delaware (32%), Montana (32%), Rhode Island (32%), South Dakota (32%) and Massachusetts (30%). No state experienced an increase in the abortion rate among 15–19-year-old women. Only one state, Texas, had no change in the abortion rate among women aged 15–19 in this period.
• Between 2011 and 2013, the abortion ratio decreased among women aged 15–19 by at least 10% in 17 states; Hawaii, Idaho, Iowa, Louisiana, Montana and West Virginia experienced decreases greater than 20%. The abortion ratio increased by at least 10% in two states (North Carolina and Texas).
State pregnancy, birth and abortion rates, abortion ratios and number of pregnancies in 2013 (Tables 2.5–2.6)
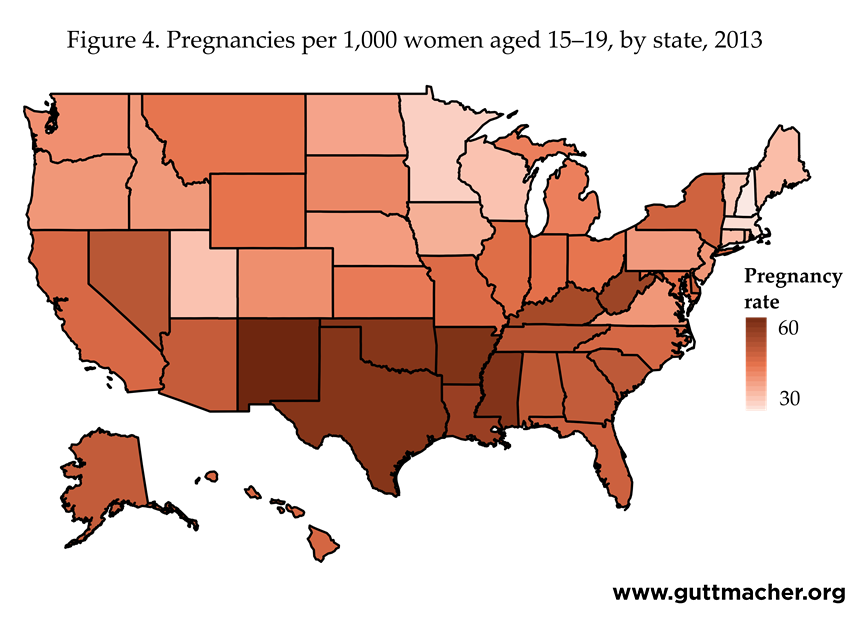
• In 2013, New Mexico had the highest pregnancy rate among women aged 15–19 (62 per 1,000 women); the next highest rates were in Arkansas (59), Mississippi (58), Oklahoma (58), Texas (58) and Louisiana (54). The lowest rates were in New Hampshire (22), Massachusetts (24), Minnesota (26), Utah (28), Vermont (28) and Wisconsin (28).
• In 2013, the birthrate among 15–19-year-old women was highest in Arkansas, New Mexico and Oklahoma (43 per 1,000 women), and the next highest rates were in Mississippi (42), Texas (41) and West Virginia (40). The lowest rates were in Massachusetts (12), Connecticut (13), New Hampshire (13), Vermont (14) and New Jersey (15).
• Abortion rates among 15–19-year-old women in 2013 were highest in New York (22 per 1,000 women), Maryland (17), New Jersey (17), Delaware (15) and Florida (15). The lowest rates were in South Dakota (3), Utah (3), Idaho (4), Kansas (4), North Dakota (4), Indiana (5), Iowa (5), Kentucky (5), Nebraska (5), West Virginia (5), Wisconsin (5) and Wyoming (5).
• In three states—New York, New Jersey and Connecticut—at least half of pregnancies to women aged 15–19 (excluding miscarriages and stillbirths) in 2013 ended in abortion (for an abortion ratio of 56%, 53% and 50%, respectively).
• In 2013, the states with the lowest proportions of pregnancies ending in abortion among 15–19-year-old women (15% or less, in ascending order) were South Dakota, Kentucky, West Virginia, Oklahoma, Arkansas, Kansas, Mississippi, Idaho, Utah, Indiana, Louisiana, North Dakota and Wyoming.
• States with the largest numbers of 15–19-year-old women also had the greatest numbers of pregnancies among women in that age-group in 2013. California recorded the highest number of pregnancies among women aged 15–19 (56,990), followed by Texas, New York, Florida and Illinois. The states with the smallest numbers of pregnancies to women aged 15–19 (fewer than 1,500 each) were, in ascending order, Vermont, Wyoming, North Dakota, New Hampshire, South Dakota, Alaska, Maine, Rhode Island, Montana and Delaware.
State pregnancy rates by race and ethnicity in 2013 (Table 2.7)
• Many states did not have or could not provide data on age combined with the race or ethnicity of women who obtained an abortion. In available data from some states, the woman’s race or ethnicity was missing for 20% or more of abortions. As a result, we are able to present pregnancy and abortion rates by race and ethnicity for 29 states; findings from these states are highlighted below. For three additional states (Iowa, Louisiana and Oklahoma), we calculated estimates by race only, irrespective of Hispanic ethnicity. For two other states (Nevada and Washington), we estimated pregnancy and abortion rates for Hispanic women aged 15–19, but not for any other racial or ethnic group. For Wisconsin, we estimated rates for white, black and other women aged 15–19 (irrespective of ethnicity) and for Hispanic 15–19-year-olds.
• Pregnancy rates for non-Hispanic white women ranged from 14 to 56 pregnancies per 1,000 women aged 15–19. Rates were highest in Southern states: Oklahoma (56), West Virginia (55), Arkansas (51), Kentucky (51), Tennessee (41) and South Carolina (40). The lowest rates were found in New Jersey (14), Minnesota (18), Utah (21), New York (22) and Wisconsin (22).
• Pregnancy rates among non-Hispanic black women were highest in New York (90 per 1,000 women aged 15–19), followed by Michigan (89), New Jersey (89), Arkansas (85) and Delaware (76). The lowest rate was in Vermont (26), followed by Idaho (32), South Dakota (34), Utah (34), Hawaii (38), Colorado (43) and Maine (43).
• Pregnancy rates among Hispanic women were highest in Delaware (95 pregnancies per 1,000 women aged 15–19), New York (77), Texas (76), Kansas (72), New Mexico (72), North Carolina (71) and Tennessee (70). Rates were lowest in Maine, Vermont and West Virginia (22, 23 and 30, respectively).
• Pregnancy rates among non-Hispanic women of races other than white and black were highest in South Dakota (103 pregnancies per 1,000 women aged 15–19), followed by Alaska (70), New Mexico (70), Oklahoma (58) and Minnesota (49); the lowest rates were found in Vermont (13), Tennessee (17), West Virginia (17), Georgia (18) and Virginia (19).
Unintended pregnancy at the state level in 2013 (Table 2.10)
• Unintended pregnancy rates are lower than pregnancy rates overall because for some pregnancies, women had wanted to become pregnant at the time they occurred (or earlier) or were not sure whether they wanted to become pregnant.
• In the 31 states with available data for 2013, unintended pregnancy rates among women younger than 20 ranged from 16 to 41 per 1,000 women.
• The highest unintended pregnancy rates among women younger than 20 were found in Arkansas (41), Oklahoma (39) and Tennessee (37); states with the lowest unintended pregnancy rates were New Hampshire (16), Minnesota (18), Massachusetts (19), Utah (19) and Vermont (19).
• The majority of pregnancies to women younger than 20 were unintended, with proportions ranging from 56% in New Mexico to 79% in Maryland and New Jersey. In about half of the 31 states, the proportion of pregnancies among women younger than age 20 that were unintended was 70% or higher. In eight of these 31 states, 75% or more of pregnancies to women younger than 20 were unintended: Maryland (79%), New Jersey (79%), New York (78%), Hawaii (76%), Wisconsin (76%), Colorado (75%), Massachusetts (75%) and Washington (75%). Other states had lower proportions of unintended pregnancies: New Mexico (56%), West Virginia (59%), Wyoming (61%), Alaska (62%), Nebraska (64%) and Pennsylvania (64%).
Discussion of Key Findings
National-level trends in pregnancy, 1973–2013
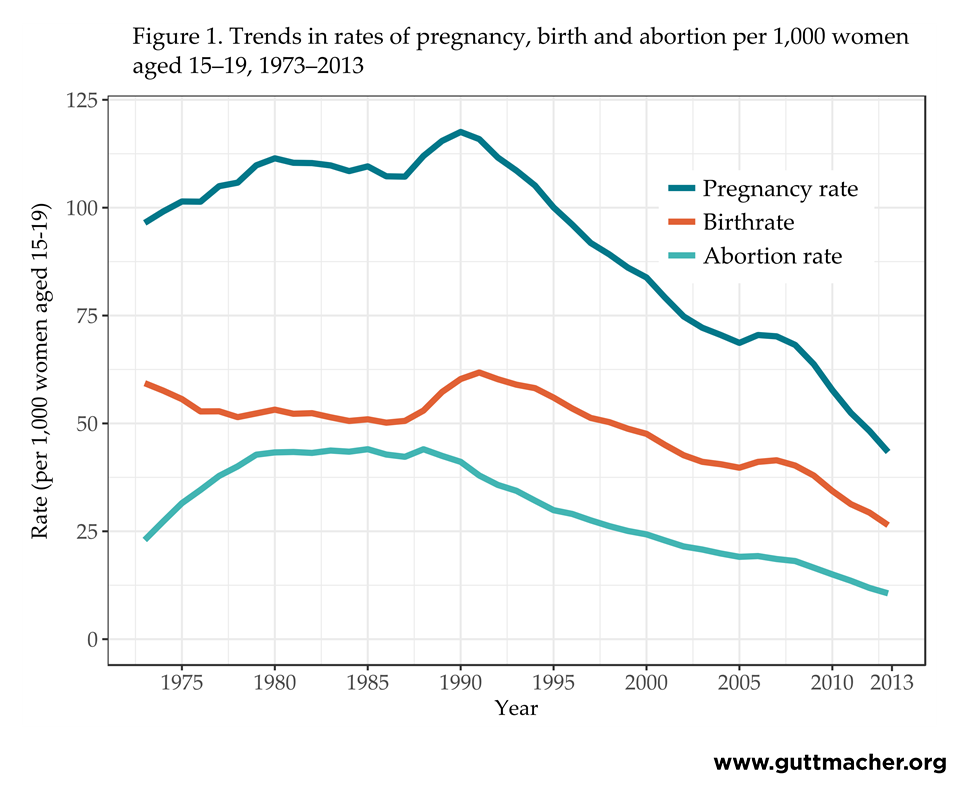
National estimates of pregnancy in 2013 show a continuation of the long-term decline in rates of pregnancies, births and abortions among young women in the United States. Pregnancy rates among women aged 15–19 have declined dramatically since a recent peak in 1990, as have the births and abortions that result (Figure 1).
Mirroring the trend among all 15–19-year-old women, there was a substantial drop in the pregnancy rate between 2007 and 2013 for both 15–17- and 18–19-year-olds. Pregnancies among 18–19-year-olds accounted for the majority of all pregnancies among women aged 15–19 (72% in 2013). As a result, decreases in pregnancies among this age-group were responsible for around three-fifths of the overall pregnancy rate decline between 2007 and 2013 among all women aged 15–19.
National-level trends in pregnancy rates of women aged 15–17 and 18–19
While the rate for women aged 18–19 has driven much of the observed decline in the overall pregnancy rate among all adolescent women, 15–17- and 18–19-year-olds may not have experienced declines to the same extent. To compare the pace of change for these two age-groups, we calculated the natural logarithm of the pregnancy rate among women aged 15–17 and 18–19 (Figure 2). This calculation rescales the year-to-year changes in pregnancy rates so that the slope of the line captures the annual percentage change and allows us to directly compare the relative change in the rate for the two age-groups across time.
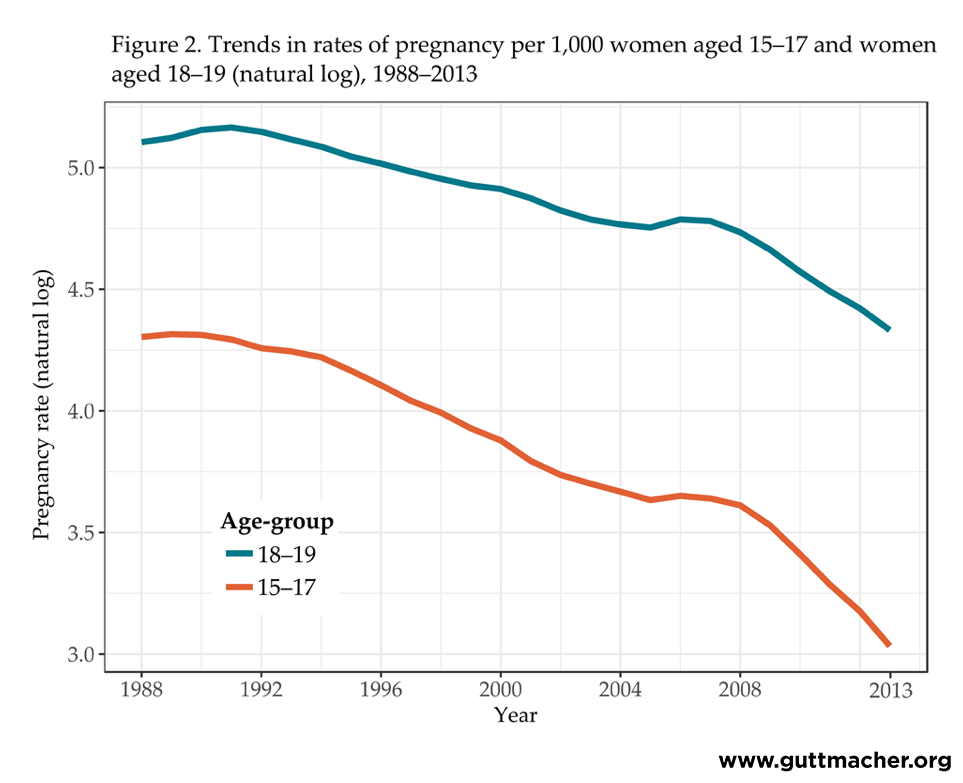
Over the past two decades, relative declines in pregnancy rates among women aged 15–17 have been steeper than those among women aged 18–19 (Figure 2). Between 1995 and 2007, pregnancy rates declined an average of about 2% each year among 18–19-year-olds and about 4% each year among 15–17-year-olds. Between 2007 and 2013, declines among the older group increased to about 7% each year and to about 10% each year among the younger women. This means that not only have women aged 15–17 experienced steeper relative declines in pregnancy rates over the long term, but the recent pace of the decline has increased more than the pace among women aged 18–19.
National-level trends in pregnancy rates by race and ethnicity
The data presented here indicate that even with the recent reductions in rates of pregnancies, births and abortions among 15–19-year-old women, there are still persistently large and long-standing differences in pregnancy experiences between racial and ethnic groups. In 2013, pregnancy, birth and abortion rates among black and Hispanic women aged 15–19 were all much higher than rates among non-Hispanic white women aged 15–19, and rates among black 15–19-year-olds were higher than those among Hispanic women of the same age. While the rates for all three groups have been declining, there is very little evidence that the differences between them have diminished.
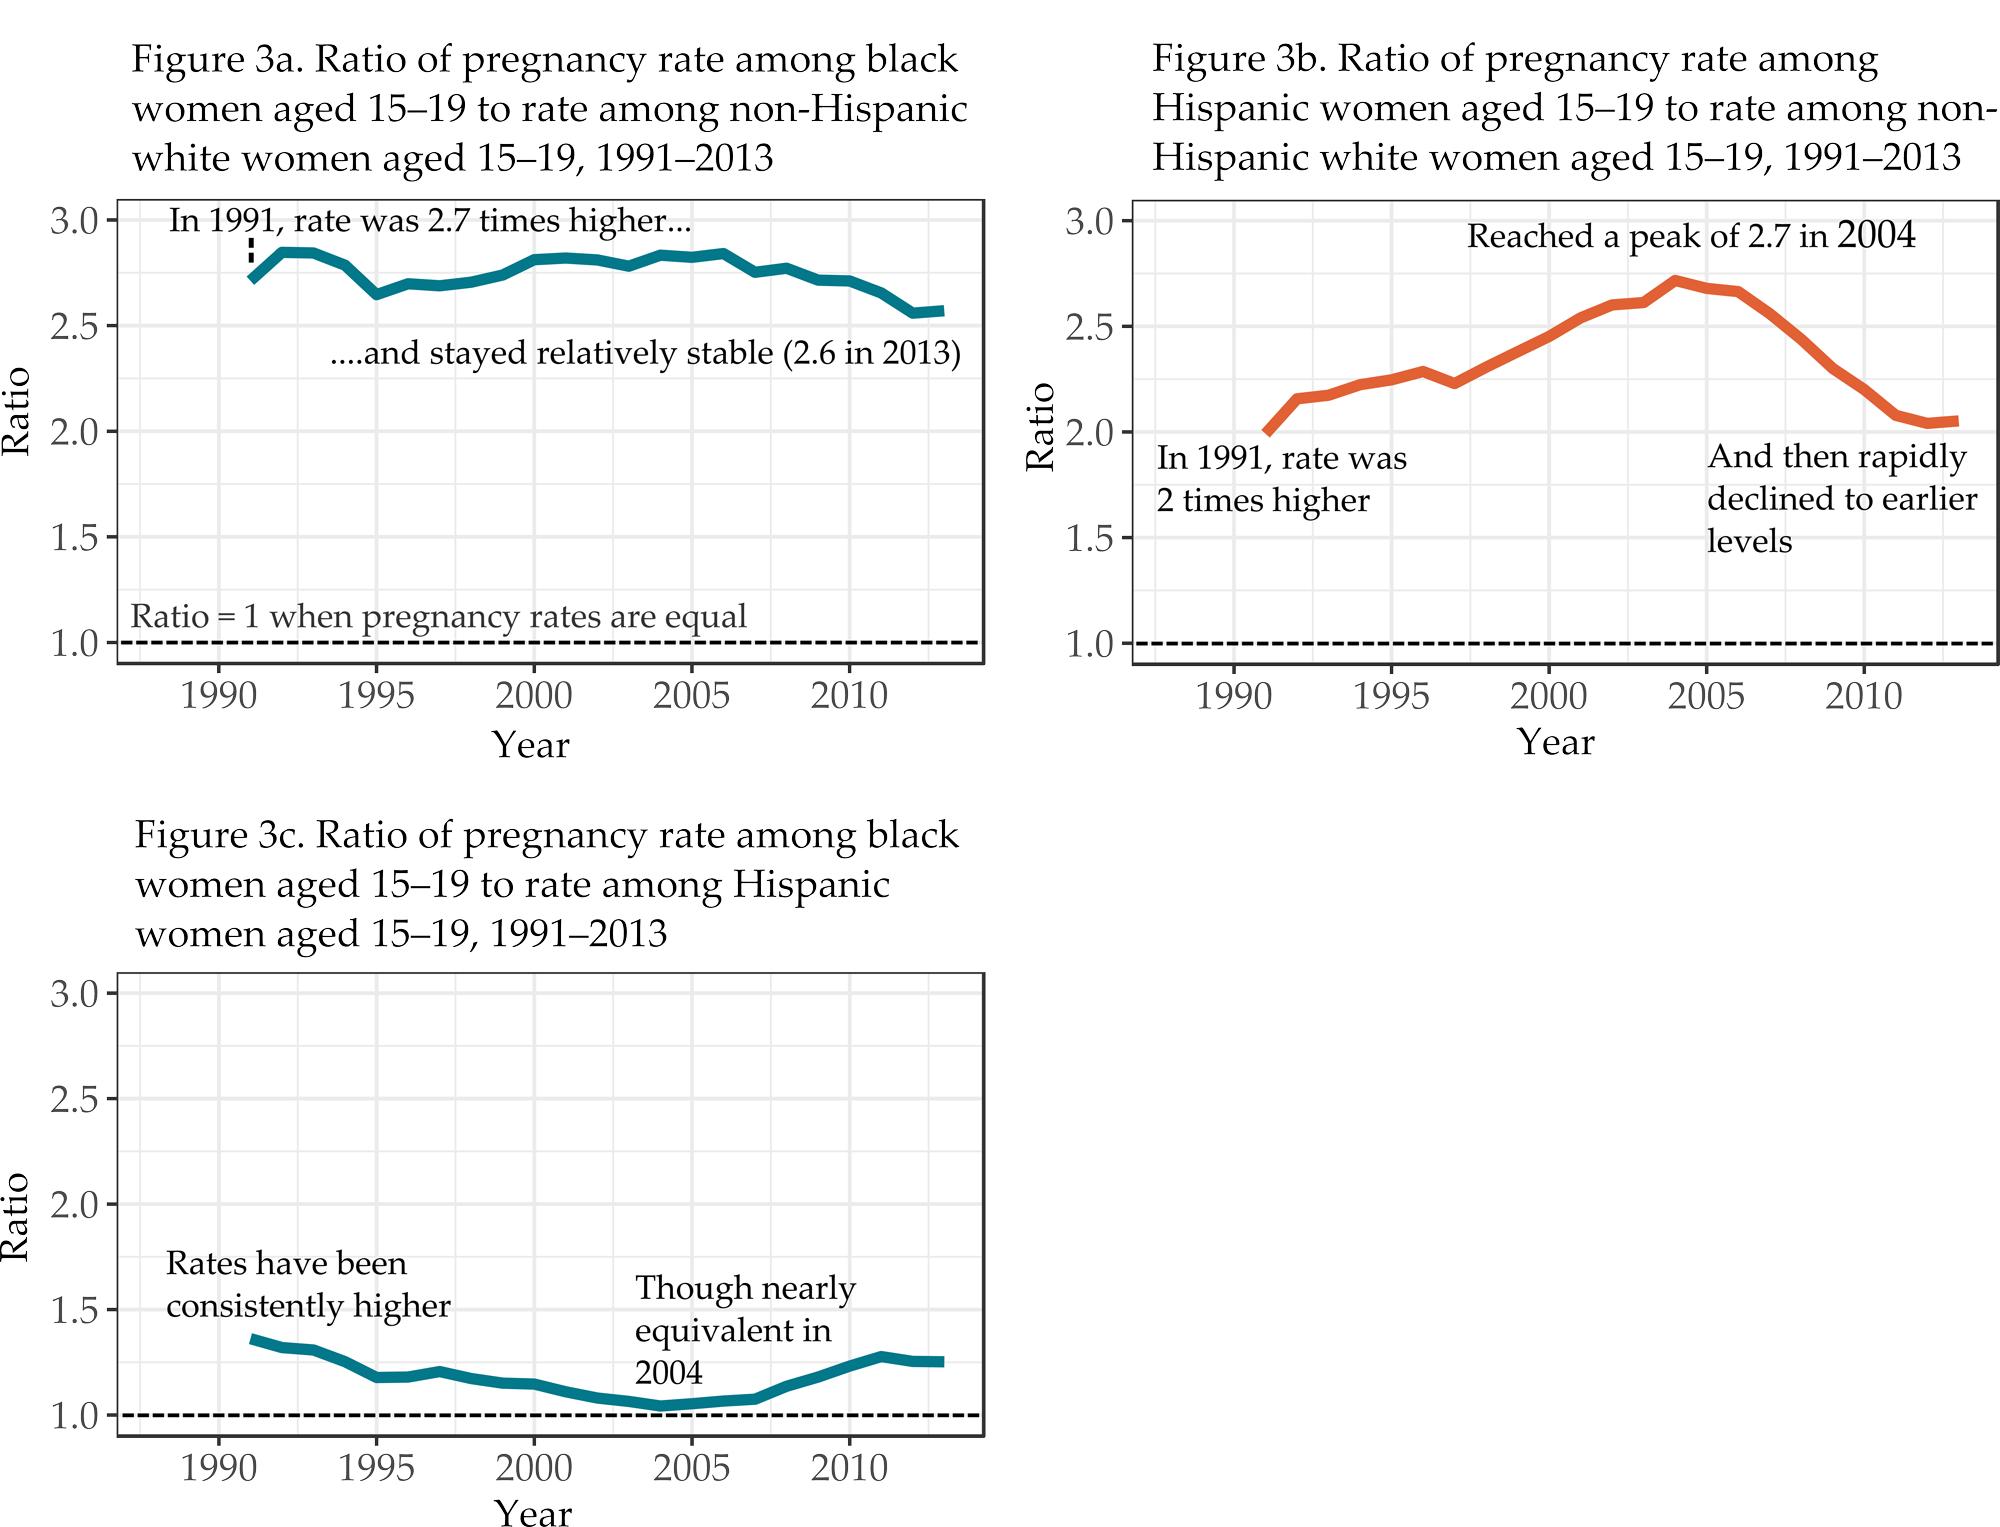
The three graphs in Figure 3 compare trends in the pregnancy rate among women aged 15–19 by race and ethnicity. For each comparison, the racial or ethnic group with the lower pregnancy rates is the reference group. The trend in the ratio of the pregnancy rate among black women aged 15–19 to the rate among non-Hispanic white women of the same age indicates that the difference between the two rates diminished somewhat between 2007 and 2011 (Figure 3a). But since 1991, black women aged 15–19 consistently have had pregnancy rates more than 2.5 times the rate of non-Hispanic white women of the same age. The rate among black women aged 15–19 was 2.7 times higher than the rate among non-Hispanic white women aged 15–19 in 1991 and 2.6 times higher in 2013.
The relative difference in the ratio of pregnancy rates among Hispanic women aged 15–19 to the rates of non-Hispanic white women in that age-group increased steadily from 1992 to 2004, with Hispanic 15–19-year-olds having increasingly higher rates than non-Hispanic white women of the same age (Figure 3b). Pregnancy rates for the former group were twice as high as for the latter in 1991 and peaked at 2.7 times higher in 2004. Then, in 2005, the difference between rates for the two groups began to shrink. The estimates for 2013 show that, while relative rate differences have narrowed in roughly the past decade, the pregnancy rate among Hispanic women aged 15–19 still remains about twice the rate as among non-Hispanic white women of the same age—roughly the same relative difference observed in 1991.
Since at least 1991, pregnancy rates among black women aged 15–19 have been consistently higher than rates among Hispanic women of the same age (Figure 3c). The difference in the rates between the two groups was greatest in 1991, when the rate among black 15–19-year-olds was about 36% higher than the rate among Hispanic 15–19-year-olds, but the difference began diminishing after that time. By 2004, black and Hispanic women in that age-group had similar rates (126.1 and 120.9 pregnancies per 1,000 women, respectively). Since that time, a more rapid decline in the pregnancy rate among Hispanic 15–19-year-olds than among black women of the same age has led to a widening of the difference in the two groups’ pregnancy rates.
State-level pregnancy rates among women aged 15–19, 15–17 and 18–19
Trends in pregnancy rates at the national level are reflected in similar patterns in nearly every state. Rates dropped consistently in nearly all states between 2008 and 2013, with accelerated declines from 2011 to 2013. Still, pregnancy rates of women aged 15–19 continue to vary considerably across states. Southern and Southwestern states, as well as states with large urban centers, tend to have the highest rates (Figure 4).
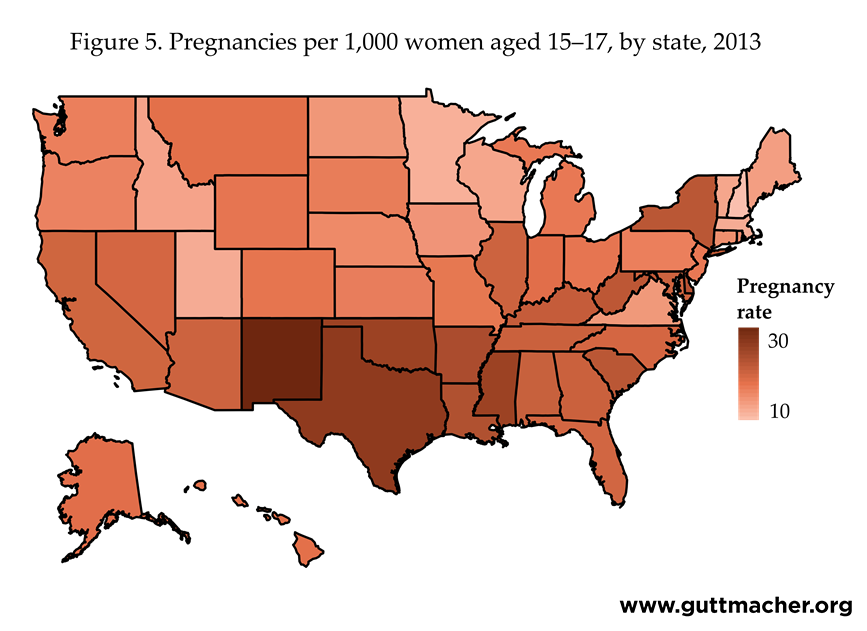
In 2013, pregnancy rates also differed by state for women aged 15–17 (Figure 5), with the highest rates among this age-group in New Mexico, Texas, Mississippi, Oklahoma and Arkansas. States with the lowest pregnancy rates among 15–17-year-old women were New Hampshire, Minnesota, Utah and Massachusetts.
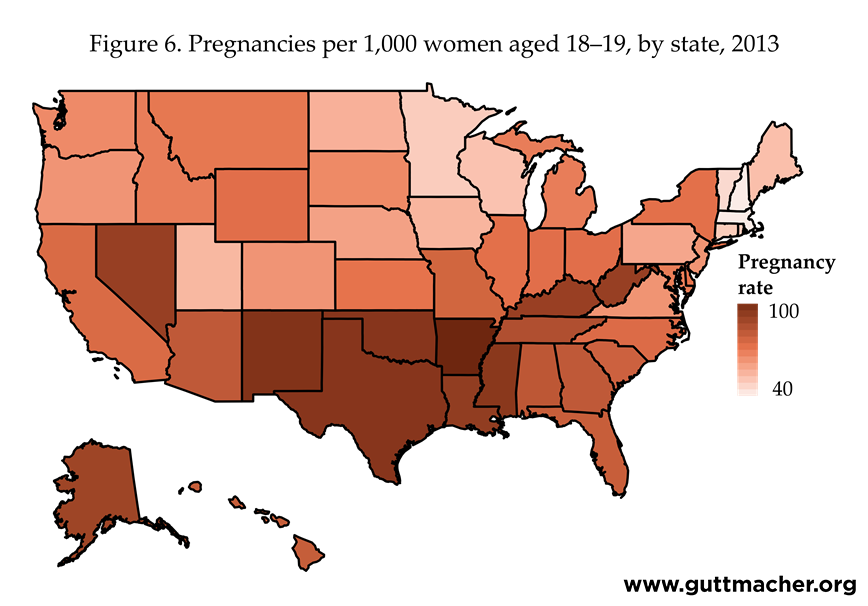
There was greater variation across states in the pregnancy rates of 18–19-year-olds than among 15–17-year-olds (Figure 6). Again, pregnancy rates among women aged 18–19 closely mirrored those among all women aged 15–19 because these older teens accounted for the majority of pregnancies in this age-group. Higher pregnancy rates among these older adolescents also tended to be concentrated in states located in the South and Southwest.
State-level pregnancy and unintended pregnancy rates among women younger than 20 years old
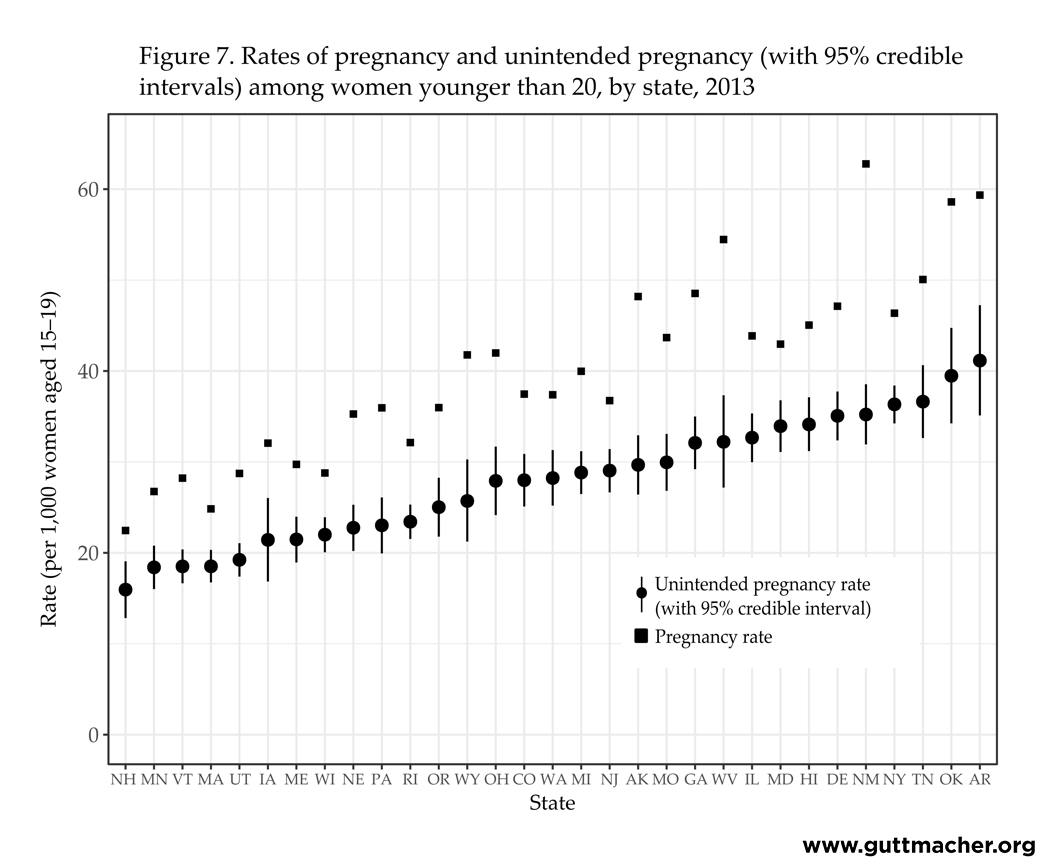
Figure 7 shows the range of unintended pregnancy rates we estimated across the states. Because these measures were obtained using survey data, they are shown with their associated "credible intervals" (comparable to a confidence interval; see Table 2.10 and Methodology section).
Figure 7 also includes the total pregnancy rate for women younger than 20. For some states, the distance between the unintended and total pregnancy rates is relatively small, indicating that a high proportion of pregnancies were unintended (e.g., New Hampshire, Massachusetts, Wisconsin and New Jersey). For other states, the distance is much greater, indicating that a lower proportion of pregnancies were unintended (e.g., Wyoming, Alaska, West Virginia and New Mexico).
It is important to highlight that the difference between the unintended pregnancy rate and the total pregnancy rate is not the intended pregnancy rate. Not all of the pregnancies categorized as not unintended were reported by the woman to have been intended (meaning the pregnancy had been wanted at the time it occurred or an earlier point in time). For a large proportion of these pregnancies, the woman reported that she had been unsure about whether she had wanted to become pregnant. Among women who did not report a birth as unintended, 25% (New York) to 72% (Pennsylvania) recalled having been unsure of whether they wanted to become pregnant (not shown). And in 14 of the 31 states for which data were available, more than half of births from non-unintended pregnancies were to women who recalled being uncertain about whether they had wanted to become pregnant.
Conclusion
This report provides updated surveillance statistics for all pregnancies to young women in the United States. This statistical portrait of the fertility experiences of women in the earliest reproductive ages improves our knowledge of characteristics of the U.S. population and trends in pregnancy, birth and abortion statistics illustrate how young women’s reproductive experiences have been changing over time, whether their pregnancies were intended or not. Continued documentation of trends in pregnancy rates contributes to greater understanding of historical changes in the lives of young Americans.
In 2013, birthrates among 15–19- and 20–24-year-old women and abortion rates among 15–19-year-old women reached historic lows. From 2007 to 2013, pregnancy rates dropped 38% among women aged 15–19 and 25% among those aged 20–24. Recent data on births from the NCHS show that birthrates continued to decline between 2013 and 2015—dropping another 16% among women aged 15–19 and an additional 5% among those aged 20–24.5,6 Age-specific abortion data are not yet available for 2015 or more recent years, so we cannot calculate pregnancy rates; however, increases in abortion are not expected, given long-standing declines in abortion rates over the past three decades.7,8
It is important to recognize that declines in the rate of births do not necessarily result from lower pregnancy rates. In theory, if abortion rates increase, the pregnancy rate could remain constant even while birthrates fall. However, trends in the abortion ratio among women aged 15–19 have shown decreasing proportions of pregnancies ending in an abortion rather than a birth, with the ratio in 2013 at its lowest level in three decades. In addition, this report demonstrates that fewer women aged 15, 15–19 and 20–24 became pregnant in 2013 than at any time since tracking of these data began, which reflects our finding that both birth and abortion rates among women in these age-groups have steadily declined.
Pregnancy rates continued to decline among 15–19-year-old women in each of the racial and ethnic groups examined in this report. But persistent differences across these groups mirror disparities consistently found in many measures of public health. Differences in overall levels of pregnancy by race and ethnicity suggest that further research should delve into the context of these pregnancies. These differences might reflect systemic inequities—including access to comprehensive sex education and health care more generally—as well as family planning and contraceptive services specifically, distinctly different social and cultural attitudes toward young parenthood, or other factors not yet fully understood.
For the first time since we began tracking pregnancy trends for these ages, this report includes calculations for rates of unintended pregnancy among women younger than 20 at the state level. We are unable to calculate parallel estimates of unintended pregnancy at the national level. State-level data is available for only 31 states and national surveys use measures of pregnancy intention that are not strictly comparable. Other research has calculated national estimates of unintended pregnancy for adolescents and young women through 2011;9 more recent years are not available. In addition, while it would be ideal to calculate pregnancy statistics by intention status for women in each age-group we track—14 and younger, 15–17, 18–19 and 20–24—we do not have sufficient data at the state level to be able to do so.
Nevertheless, these new estimates of unintended pregnancy represent a step forward in measurement, surveillance and understanding of fundamental sexual and reproductive health indicators. Not all pregnancies to women younger than 20 are unwanted or unintended. The majority of pregnancies among these young women are to those aged 18 and 19, some of whom may want to become parents. The youngest women in this age range (those aged 17 or younger) may be the most likely to have an unintended pregnancy. In the data we used to calculate unintended pregnancy rates at the state level, the majority of births to women aged 17 or younger (68%) were reported to have been from unintended pregnancies compared with a somewhat lower proportion—although still a majority—among women aged 18–19 (58%).‡ Further, even among young women who had births that were not reported as having been unintended, the majority were reported as occurring when the woman had been unsure about whether she wanted a baby (68% among those aged 17 or younger and 45% among those aged 18–19).
Trends in pregnancy, birth and abortion will need to be closely monitored over the coming years to determine how the reproductive experiences of young women in the United States are changing. Further research will be needed to understand the behavioral, social and economic factors that are affecting these trends. Specifically, research will need to address not just why fewer young women are having births, but also why fewer are becoming pregnant. One recent analysis of the proximate determinants of pregnancy risk among 15–19-year-old women estimated that the entire decline in their risk from 2007 to 2012 could be attributed to improved contraceptive use, rather than changes in sexual activity (for which there was no evidence of change over the same time period).10 The study found significant increases in use of any contraceptive method, use of multiple methods and use of highly effective methods, as well as a decline in contraceptive nonuse among women aged 15–19. There is further evidence of change in contraceptive practices among women aged 18–19: the proportion of these women who reported using long-acting reversible contraceptive methods tripled between 2007 and 2009,11 and changing medical guidelines have highlighted these methods as appropriate for use among young women.12–14
Another recent study found that contraceptive failure rates measured among U.S. women surveyed in 2006–2010 were significantly lower than failure rates among women using contraceptive methods in 1995; these declines were also found among the youngest female contraceptive users, those younger than 20.15 The findings from these studies imply that much of the observed recent decline in pregnancy rates among young women is being driven by improvements in contraceptive use—whether use of any method is becoming more widespread, effectiveness with which methods are used is improving or both.
Given that not all pregnancies to women younger than 20 are unintended, further research is needed to understand childbearing desires and reproductive behaviors of young women and to understand the differing trends in pregnancy across racial and ethnic groups. Assumptions that factors leading to declining rates among one group are the same as those among another may not be valid.
This report finds that, in 2013, pregnancy—as well as the births and abortions that follow—have all declined to historic lows among young women in the United States. In 2013, the pregnancy rate among women aged 15–19 reached its lowest level in at least 80 years.§ We also found these declines in every state. Continued surveillance of pregnancy, birth and abortion statistics will allow for further investigation and greater understanding of the processes that underlie these trends.
About the Tables
Pregnancies are the sum of births, abortions and fetal losses (i.e., miscarriages and stillbirths). Rates are calculated as the number of events per 1,000 women. Abortion ratios are the number of abortions divided by the sum of abortions and births. Fetal losses are excluded from the denominator of this ratio because the ratio is intended to represent how women choose to resolve a pregnancy, and those ending in miscarriage or stillbirth are considered to be beyond the control of the pregnant woman.
In these tables, "age" refers to the woman’s age when the pregnancy ended. Most of the women who conceived at age 19 had their births or abortions after they turned 20 and, thus, their pregnancies were not counted among the 15–19-year-old or 18–19-year-old age-groups. Therefore, the pregnancy rates among these groups are likely higher than the estimates in this report. Likewise, "year" refers to the calendar year in which the birth, abortion or fetal loss occurred, not when the conception occurred.
Methodology
The national-level estimates in Figures 1–3 and Tables 1.1–1.7 are based on data from the following sources (detailed below in the Data Sources section):
- Number of births—National Center for Health Statistics (NCHS) vital statistics
- Number of abortions—Guttmacher Institute Abortion Provider Census
- Number of fetal losses (stillbirths, miscarriages and ectopic pregnancies)—estimated as a proportion of births and of abortions
- Distribution of abortions by age and race or ethnicity—U.S. Centers for Disease Control and Prevention (CDC) surveillance reports
- Population of women—Population Estimates Program of the U.S. Census Bureau, in collaboration with NCHS
The state-level estimates in Figures 4–7 and Tables 2.1–2.10 are based on data from the following sources (detailed below in the Data Sources section):
- Number of births—NCHS vital statistics
- Number of abortions to residents of each state—Guttmacher Institute, CDC and state health departments
- Number of fetal losses—estimated as a proportion of births and of abortions
- Distribution of abortions by age and race or ethnicity—state health departments
- Population of women—Population Estimates Program of the U.S. Census Bureau, in collaboration with NCHS
The estimates in Figure 7 and Table 2.10 also use the data indicated above for state-level estimates. In addition, data on pregnancy intention status are drawn from the following sources (detailed below in the Data Sources section):
- Distribution of births by pregnancy intention—CDC’s Pregnancy Risk Assessment Monitoring System (PRAMS)
- Distribution of abortions by pregnancy intention—Guttmacher Institute 2014 Abortion Patient Survey
Births
The numbers of births occurring in the United States and in each state in each calendar year are obtained from NCHS’s National Vital Statistics System. The data are based on information abstracted from birth certificates filed in vital statistics offices of each state and the District of Columbia.17 Births are categorized by race and ethnicity of the mother, and include those of unknown ethnicity so as to be comparable with abortion estimates for these groups.
Birthrates include instances of multiple births (twins and higher order births). This leads to our pregnancy rates (which are the sum of birthrates, abortion rates and fetal loss rates) being slightly overestimated, as multiple births originate from a single pregnancy. Because multiple births are rare among younger women (fewer than 2% among women aged 15–19 in 2013, a proportion that has been relatively stable across time, as well as across racial and ethnic groups), there is not much impact on pregnancy rates estimated in this report. Accounting for multiple births among 15–19-year-olds in 2013 would decrease the pregnancy rate for this age-group from 43.4 to 43.2.
Abortions: National-level estimates
The number of abortions performed each year in the United States is derived from the Guttmacher Institute’s periodic census of all identifiable abortion providers. The Institute’s first six abortion provider censuses were conducted annually between 1974 and 1979, with each gathering data for the preceding year (1973 through 1978). Censuses were then conducted in 1981, 1983, 1986 and 1989, with each gathering data for the preceding two years. Subsequent censuses were carried out in 1993, collecting data for 1991 and 1992; in 1997 (data for 1995 and 1996); in 2001–2002 (data for 1999 and 2000); in 2006–2007 (data for 2004 and 2005); in 2010–2011 (data for 2007 and 2008); in 2012–2013 (data for 2010 and 2011); and in 2015-2016 (data for 2013 and 2014; see Data Sources section for further detail). Data were not collected for 1983, 1986, 1989, 1990, 1993, 1994, 1997, 1998, 2001, 2002, 2003, 2006, 2009 or 2012. Estimates for these years were obtained by linear interpolation using estimates for adjacent years, and were adjusted for trends in the CDC’s annual abortion surveillance reports. Estimates in this report include only reported legal abortions. There is evidence that illegal abortions were performed for some time after the U.S. Supreme Court effectively legalized the procedure in 1973,18 but we do not have accurate records or estimates of the number. Thus, our estimates of pregnancy in the early-to-mid-1970s may be underestimated.
While the total counts of abortions occurring each year in the United States are obtained from the Institute’s provider censuses, the numbers occurring among each age-group are obtained using data on the characteristics of abortion patients from CDC annual surveillance reports. For each year since 1969, the CDC has compiled abortion data provided voluntarily by state health departments, most of which maintain an abortion reporting system similar to the system of reporting births on birth certificates. However, not all states require the reporting of abortions from providers, and states that do have reporting systems differ in the completeness of reporting, the types of providers that must report and the information obtained on the abortion certificate. In addition, not all states that collect abortion data report the results to the CDC every year, and the data on age and other characteristics sometimes have a high proportion of missing values.
To ensure that our estimates do not reflect the year-to-year fluctuations in which states report to the CDC, or fluctuations in the quality or completeness of data reported rather than true changes in the distributions of characteristics of women obtaining abortions, we use a methodology developed several decades ago by Guttmacher Institute research staff. This methodology calculates yearly changes using only data from those states that are comparable to the previous year, and then applies these changes to an ongoing historical trend anchored by a "base" year. We consider states to be comparable if they reported data on abortions by age to the CDC in both years, if there was no more than a 4% change in the percentage of abortions for which the age of the woman was unknown and if the population of women for which abortion information by age was collected (residents of the state, for example) was comparable between years. A parallel methodology was used to obtain comparable estimates of abortions by race and ethnicity over time.
Prior to our report with estimates for the year 2011, we used a base year of 1976 for national estimates; the base year for estimates by race and ethnicity was 1990 (the earliest year for which reliable data on these subgroups were available). In our report on 2011 data, we reset the base year for all trends to 2010 and recalculated estimates for all years prior to 2011 using this new reference year as an anchor; the effect of the recalibration on our estimates was small.1 In this report, for estimates through 2013, we continued with a base year of 2010. As in our report on pregnancy statistics as of 2011, estimates for years prior to 2011 differ from those previously published by the Guttmacher Institute. In some cases, we were unable to locate the original source data and were unable to reproduce some specific estimates published in previous reports (e.g., pregnancy rates for 15–19-year-old Hispanic and non-Hispanic white women in 1990).
We rely on tables published by the CDC on the national distribution of abortions by age and race to obtain the national numbers of abortions among women aged 15–19 in each racial and ethnic group. For the years 1990–2000, the CDC publications combined black and other races in these tables; therefore, our calculations for 1990–2000 were based on the assumption that the proportion of abortions to black women and women of other races among 15–19-year-olds were the same as the proportion of abortions to black women and women of other races among all ages combined. This assumption was tested in subsequent years (for which black and other races were not combined in CDC tables of age by race) and did not have any substantial effect on estimates for these racial groups. Tables for age by Hispanic ethnicity became available only in 1991. Furthermore, until recently, the CDC surveillance report did not include abortion estimates by age combined with race and ethnicity. To obtain estimates of abortions to non-Hispanic white women prior to 2011, we assumed that the proportion of abortions among Hispanic women that were to white women of Hispanic origin was equal to the proportion of births among Hispanic women that were to white women of Hispanic origin. We then subtracted these estimates from the total number of abortions to white women to arrive at estimates of abortions to non-Hispanic white women. In recent years, the table in the CDC’s report showing the distribution of abortions by age combined with both race and ethnicity has included data from an expanding number of states, which has increased our confidence in the stability of these estimates. Thus, we began using the CDC combined tables to calculate abortion estimates for non-Hispanic white, non-Hispanic black and non-Hispanic other 15–19-year-old women as of 2011 (see Table 1.7).
Abortions: State-level estimates
The Guttmacher Institute’s Abortion Provider Censuses provide the annual numbers of abortions occurring in each state for 1988, 1992, 1996, 2000, 2005, 2008, 2010, 2011 and 2013. Starting with the number of abortions performed in each state for women of all ages (residents and nonresidents),7,8 we reassigned abortions to the woman’s state of residence on the basis of information collected by state abortion reporting agencies. The CDC compiles this information in an annual table showing, for each state, the state of residence for all women who had an abortion in that state.19 The CDC table suppresses information on any combination of state of residence and state of occurrence with fewer than 50 abortions, so we used more complete data for 2013 available from many state health department websites and, where necessary, contacted the states directly for this information. Some states do not collect this information; for these states,** we asked a sample of abortion facilities where the women obtaining abortions said they lived. From the total of each state’s residents who had an abortion, the proportions who were younger than 15, 15–17 and 18–19 were taken from the CDC Abortion Surveillance report.4 For states with incomplete or no information on the age of women who had an abortion in 2013,†† we estimated the proportion of abortions obtained by women aged 15, 15–17 and 18–19 by using the national distribution or the distribution from neighboring states (see notes to tables for state-specific calculation methods). Finally, we applied a small adjustment factor to the state-specific abortion distributions so they would sum to the national distributions of abortions by age.
The CDC does not release data with state-specific distributions of abortions by age and race or ethnicity; we contacted state health departments for this information or, in a few states, were able to obtain it from the state’s department of health website. The distributions were then applied to our estimate of the number of abortions obtained by state residents aged 15–19. We made no estimates for states that did not provide the data or those with a large proportion of abortions for which the woman’s race or ethnicity was unknown (i.e., missing for greater than 20% of cases).‡‡ Four states (Iowa, Louisiana, Oklahoma and Wisconsin) provided data for white, black and other women irrespective of Hispanic ethnicity; for these states, pregnancies and abortions were calculated for these groups in place of non-Hispanic white, non-Hispanic black and non-Hispanic other races.
Our calculation methods assume that women younger than 18 travel outside their home state for abortion services in the same proportions as do older women. This assumption may not be valid in states with parental involvement requirements or in surrounding states to which women younger than 18 may travel to obtain an abortion. There is need for further research on the extent to which young women are traveling out of state because of these requirements.
Fetal losses
Accurate estimates of the incidence of pregnancy include those conceptions that do not result in induced abortion or live birth. The majority of these pregnancies end in spontaneous abortion ("miscarriage"), while smaller numbers end in stillbirth (most often defined as pregnancy loss after the 20th week of pregnancy) or ectopic pregnancy (implantation of a fertilized ovum outside of the main uterine cavity). Stillbirths are generally reported by hospitals in death records. Many states collect miscarriage data, but reporting is incomplete, particularly for miscarriages that occur prior to 20 weeks’ gestation. In fact, many women experience a very early miscarriage without realizing it, perhaps experiencing what they believe to be a late menstrual period. Our estimates of pregnancy include only recognized fetal losses.
We estimated recognized fetal loss as the sum of a proportion of births (20%) and of abortions (10%). While these proportions are rough approximations for the numbers of recognized fetal losses, it is important to account for the fact that the incidence of fetal loss in a population is dependent upon the ratio of abortions to births. Pregnancies terminated by induced abortion are exposed to lower risk of fetal loss than pregnancies that are continued to term, especially if the abortion occurs in the early weeks of the pregnancy. Most miscarriages occur by the 14th week of pregnancy20 and more than 90% of abortions occur before that time.4 Estimation of fetal loss as a proportion of births and abortions allows us to account for these different gestation-dependent risks associated with pregnancies that end early (abortions) and those that end later (births). Put simply, the more pregnancies terminated by abortion, the less opportunity for a miscarriage to occur and the lower the overall incidence.
It is possible to obtain other estimates of fetal loss. In particular, NCHS pregnancy statistics use the nationally representative National Survey of Family Growth (NSFG) to estimate national-level incidence of recognized fetal loss from women’s reports of pregnancy loss.21 However, these estimates are obtained for a specific period of time, covering from five to seven years before the year of the survey. For this report, we calculated annual rates over a time period of more than 40 years. Instead of using rates for a particular period, we used an approximation—20% of births and 10% of abortions—so that the estimation of fetal loss is sensitive to changes in the relative distribution of births and abortions over this longer period. This is important because in times when abortion rates are high, relatively fewer fetal losses can occur. Failure to account for changes in the relative distribution of births and abortions would mean that the incidence of fetal losses could be over- or underestimated, as would be the overall pregnancy rates.
Finally, these proportions—20% and 10%—are intended only as approximations based on what little data are available on the incidence of fetal loss.20,22,23 The precise proportions are likely not as important as the recognition that the incidence of induced abortion in relation to births affects the estimates of fetal loss considerably.
Sexually experienced 15–19-year-old women: National-level estimates
We applied the percentage of women aged 15–19 reporting ever having had sexual intercourse to population totals of women in that age range in each year to calculate the number who were sexually experienced. That number served as the denominator for our pregnancy rates among sexually experienced 15–19-year-olds. The percentages of women aged 15–19 who were sexually experienced for the years 1982 and 1988 were obtained from the 1982 and 1988 rounds of the NSFG. Linear interpolation was used to calculate the percentages for the intervening years shown in Table 1.1. In the 1982 NSFG, "sexually experienced" was defined as having ever had sex after menarche. To calculate the percentage of sexually experienced 15–19-year-old women for 1988–2002, we obtained the proportions of all 15–19-year-olds who had ever had sexual intercourse in analyses of the 1988, 1995, 2002 and 2006–2008 NSFG. From 1988 on, "sexually experienced" has been defined as having ever had sex, regardless of whether it occurred before or after menarche. Linear interpolation was used to calculate the percentages for the intervening years (1989–1994, 1996–2001 and 2003–2006). In 2006, the NSFG began continuous data collection, such that data collected across 24-month time frames can be considered representative samples of those periods (i.e., June 2006–June 2008, July 2008–June 2010, September 2011–September 2013 and September 2013–September 2015). We consider the full calendar year in the midpoint of each two-year interval as the reference year for that estimate. Estimates obtained from the 2006–2008 surveys provide data points for 2007, those from 2008–2010 can be considered representative of 2009, 2011–2013 data provide estimates for 2012, and 2013–2015 provide estimates for 2014. We obtained intervening years by interpolation. Thus, we calculated the proportion sexually experienced in 2008 by averaging the proportions estimated in the 2006–2008 and 2008–2010 NSFG data. For 2010 and 2011, we interpolated percentages using the values from the 2008–2010 and 2011–2013 NSFG data, and for 2012 and 2013 we interpolated percentages based on values from the 2011–2013 and 2013–2015 NSFG.
Unintended pregnancy rates among women younger than 20: State-level estimates
The unintended pregnancy rate in each state is the sum of all unintended births, abortions and fetal losses divided by the population of resident women aged 15–19. Estimates of unintended pregnancy are calculated from several sources. First, we obtained the proportion unintended among births to women younger than 20 from the state-level Pregnancy Risk Assessment Monitoring System (PRAMS) surveys.§§ These surveys are conducted among women giving birth each year; the sample is drawn from annual birth certificate records in each state. The data are representative of all mothers in the state for the year of the survey. For our estimates of pregnancy intentions for 2013 births, we combined data from the 2012 and 2013 surveys to ensure robust estimation, given that sample sizes among the youngest mothers are smaller than those among older mothers.
The PRAMS survey asks mothers about the pregnancy intention status of the birth—whether the respondent had wanted to be pregnant at the time it occurred, wanted to be pregnant sooner, wanted to be pregnant later, did not want to be pregnant then or at any time in the future, or was unsure at the time about what she wanted. We categorized all births from pregnancies that had been wanted later than they occurred or not wanted at all as unintended. Although many states conducted a PRAMS survey in 2012 and 2013, at the time of this analysis the CDC did not release PRAMS data for any state survey with a response rate below 65%. This analysis included only those states that achieved this response rate or higher (31 states). We obtained weighted proportions of births that had originated as unintended pregnancies from each of these state PRAMS surveys. For some estimates mentioned in the text, we also calculated proportions among all 15–17-year-olds and all 18–19-year-olds from all 31 state PRAMS surveys combined. These numbers should not be interpreted as national estimates, but simply as representative of the 31 states included in our tables.
For the proportion of abortions to women younger than 20 that originated as unintended pregnancies, we calculated weighted proportions unintended from the Guttmacher Institute’s nationally representative 2014 Abortion Patient Survey (APS). Although the question used to determine the intention status of the pregnancy in the APS is not identical to the question asked among women having births in PRAMS, the items allow similar response categories, and we assumed that question similarity was enough to calculate a comparable proportion of unintended pregnancies.*† This estimate is weighted to the population of all 15–19-year-old women nationally. Because we do not have state-specific estimates for abortions from unintended pregnancies, we used this national estimate in calculating the unintended pregnancy rate for each state. Nationally, the proportion of abortions that resulted from unintended pregnancies among women aged 15–19 is extremely high (98% in 2014); this proportion is generally similar across age-groups and survey years, and thus unlikely to vary substantially between states. Because of this assumption, however, any variation between states observed in our estimates of unintended pregnancy rates is driven only by variation in the proportion of births that are from unintended pregnancies and the proportion of pregnancies that result in a birth or abortion (the abortion ratio).
As with the estimates of pregnancy rates, we included fetal loss resulting from an unintended pregnancy by calculating the number of "unintended" fetal losses as the sum of 20% of births from unintended pregnancies and 10% of abortions from unintended pregnancies. In doing so, we assumed that the intention status of a pregnancy is unrelated to whether or not it ends in a fetal loss. Finally, the unintended pregnancy rate in each state is the sum of resident births and abortions, plus fetal losses calculated from each, divided by the population of resident women aged 15–19.
Because we estimated unintended pregnancy rates among women younger than 20 for each state using sample surveys, we also calculated estimates of the variation surrounding these rates. These are shown in Table 2.10 and Figure 7 (as "credible intervals") and express the range of values within which the true rate is likely to be found. A detailed explanation of the calculation of these intervals is included in the Appendix.
Other sources of pregnancy statistics
The estimates in this report may differ from those found in other sources. First, for national-level estimates provided by the NCHS and Finer and Zolna, fetal loss is estimated as a proportion of births from survey respondents' reports of their births and fetal losses in the five or seven years preceding the fielding of each round of the NSFG.9,21 Second, the denominator we used in calculating rates among women younger than 15 is the female population aged 14, because most pregnancies occurring among these very young women are likely among 14-year-olds (this was true for 83% of births in 2013). The NCHS and Finer and Zolna estimates use the number of women aged 10–14 for the denominator. We used the number of women aged 15–19 in the denominator for rates among all women younger than 20 because from 1973–2013, nearly all (97–98%) pregnancies to women younger than 20 were among those aged 15–19. Finally, our denominators are based on population estimates that are produced by the Census Bureau, in collaboration with NCHS, for July 1 of each year and revised periodically. Our rates may differ slightly from those published elsewhere, depending on which year the population estimates were made (the "vintage" of those estimates) and whether the rates have been updated using the intercensal population estimates available after each national census. We update our rates when the intercensal estimates are released. For the years 1980, 1990, 2000 and 2010, NCHS uses the April 1 census counts; we used the July 1 estimates for these and all other years.
FOOTNOTES
*Other races include Native American, Asian and Pacific Islander, and any other racial identities provided that were not white or black. While pregnancy experiences likely vary widely within this category, there were insufficient numbers to calculate race-specific rates.
†State comparisons in text and figures exclude the District of Columbia, which is more comparable to other cities than to states.
‡We pooled data from the 31 states where available to obtain these estimates.
§And possibly the lowest level in the history of the United States; comparable data on births reach back only to 1933, when almost all states had finally joined the national vital registration system. In 1933, the birthrate among 15–19-year-old women was 42.1 per 1,000 women. A pregnancy rate for 1933 comparable to those produced in this report would be higher than the birthrate because it would include miscarriages and abortions. Even in the absence of any abortions among this age-group in 1933, a comparable pregnancy rate (births plus miscarriages) would have been 50.5—higher than the rate among this age-group in 2013 (43.4).16
**California, Florida, Iowa, Maryland, Massachusetts, New Hampshire and Wyoming.
††California, Florida, Maryland, New Hampshire and Wyoming.
‡‡We made exceptions for two states—Nevada and Washington—for which we calculated rates for Hispanic 15–19-year-olds despite higher proportions of abortions with missing data on the woman’s ethnicity (21% and 22%, respectively).
§§Publicly available PRAMS data does not distinguish births by single years of age for women younger than 17.
*†In the PRAMS questionnaire, women are asked: "Thinking back to just before you got pregnant with your new baby, how did you feel about becoming pregnant?" Answer choices are: a) I wanted to be pregnant later, b) I wanted to be pregnant sooner, c) I wanted to be pregnant then, d) I didn’t want to be pregnant then or at any time in the future, or e) I wasn’t sure what I wanted. In the APS, women are asked: "Right before you became pregnant, did you want to have a(nother) baby at any time in the future?" Answer choices are: a) Yes, b) No, c) Not sure, don’t know, or d) Didn’t care. Women who answered a, c or d were then asked, "So would you say you became pregnant (please check only one): a) Too soon, b) At the right time, c) Later than I wanted, or d) Didn’t care."
References
1. Kost K and Maddow-Zimet I, U.S. Teenage Pregnancies, Births and Abortions, 2011: National Trends by Age, Race and Ethnicity, New York: Guttmacher Institute, 2016, https://www.guttmacher.org/report/us-teen-pregnancy-trends-2011.
2. Kost K and Maddow-Zimet I, U.S. Teenage Pregnancies, Births and Abortions, 2011: State Trends by Age, Race and Ethnicity, New York: Guttmacher Institute, 2016, https://www.guttmacher.org/report/us-teen-pregnancy-state-trends-2011.
3. Centers for Disease Control and Prevention (CDC), National Vital Statistics System, http://www.cdc.gov/nchs/data_access/vitalstatsonline.htm.
4. Jatlaoui TC et al., Abortion surveillance—United States, 2013, Morbidity and Mortality Weekly Report, 2016, Vol. 65, No. 12.
5. Martin JA et al., Births: final data for 2015, National Vital Statistics Report, 2017, Vol. 66, No 1.
6. Martin JA et al., Births: final data for 2013, National Vital Statistics Report, Vol. 64, No. 1.
7. Jones RK and Kooistra K, Abortion incidence and access to services in the United States, 2008, Perspectives on Sexual and Reproductive Health, 2011, 43(1):41-50.
8. Jones RK and Jerman J, Abortion incidence and service availability in the United States, 2014, Perspectives on Sexual and Reproductive Health, 2017, 49(1):17–27.
9. Finer LB and Zolna MR, Declines in unintended pregnancy in the United States, 2008–2011, New England Journal of Medicine, 2016, 374(9):843–852, http://nejm.org/doi/full/10.1056/NEJMsa1506575.
10. Lindberg L, Santelli J and Desai S, Understanding the decline in adolescent fertility in the United States, 2007–2012, Journal of Adolescent Health, 2016, 59(5):577–583.
11. Finer LB, Jerman J and Kavanaugh ML, Changes in use of long-acting contraceptive methods in the United States, 2007–2009, Fertility and Sterility, 2012, 98(4):893–897.
12. Committee on Adolescent Health Care, Long-Acting Reversible Contraception Working Group, Adolescents and long-acting reversible contraception: implants and intrauterine devices, Committee Opinion, 2012, No. 539.
13. CDC, U.S. selected practice recommendations for contraceptive use, 2013: adapted from the World Health Organization Selected Practice Recommendations for Contraceptive Use, 2nd Edition, Morbidity and Mortality Weekly Report, 2013, Vol. 62, No. RR-5.
14. Society for Adolescent Health and Medicine, Improving knowledge about, access to, and utilization of long-acting reversible contraception among adolescents and young adults, Position Statement, Journal of Adolescent Health, 2017, 60(4):472–474.
15. Sundaram A et al., Contraceptive failure in the United States: estimates from the 2006–2010 National Survey of Family Growth, Perspectives on Sexual and Reproductive Health, 2017, 49(1):7–16.
16. Linder FE and Grove RD, Vital Statistics Rates in the United States, 1900–1940, Washington, DC: U.S. Government Printing Office, 1947.
17. National Bureau of Economic Research, NCHS’ Vital Statistics Natality Birth Data: 1968–2015, http://www.nber.org/data/vital-statistics-natality-data.html.
18. CDC, Abortion Surveillance, Annual Summary 1973, Atlanta: CDC, 1975.
19. CDC, Abortions distributed by state of maternal residence and state of clinical service, no date, http://www.cdc.gov/reproductivehealth/Data_Stats/Abortion.htm.
20. Leridon H, Human Fertility: The Basic Components, trans. Helzner JF, Chicago: University of Chicago Press, 1977, Table 4.20.
21. Ventura SJ et al., Estimated pregnancy rates and rates of pregnancy outcomes for the United States, 1990–2008, National Vital Statistics Reports, 2012, Vol. 60, No. 7.
22. Bongaarts J and Potter RE, Fertility, Biology, and Behavior: An Analysis of the Proximate Determinants, New York: Academic Press, 1983.
23. Avalos LA, Galindo C and Li D, A systematic review to calculate background miscarriage rates using life table analysis, Birth Defects Research (Part A), 2012, 94(6):417–423.
Data Sources
Population
1973–1989: National Cancer Institute, Survey of Epidemiology and End Results (SEER) U.S. State and County Population Data, http://www.nber.org/data/seer_u.s._county_population_data.html.
1990–1999: National Center for Health Statistics (NCHS), Intercensal estimates of the July 1, 1990–July 1, 1999, United States resident population by year, county, single-year of age, bridged-race, Hispanic origin, and sex, file icen_natA1.txt, July 26, 2004, http://www.cdc.gov/nchs/nvss/bridged_race.htm.
2000–2009: NCHS, Intercensal estimates of the July 1, 2000–July 1, 2009 United States resident population by year, county, single-year of age, bridged-race, Hispanic origin, and sex, file icen_state2000_2009.sas7bdat, Oct. 26, 2012, http://www.cdc.gov/nchs/nvss/bridged_race.htm.
2010–2013: NCHS, Estimates of the April 1, 2010, July 1, 2010–July 1, 2014 United States resident population from the Vintage 2014 postcensal series by year, county, single-year of age, bridged-race, Hispanic origin, and sex, file pcen_v2014.txt, June 30, 2015, http://www.cdc.gov/nchs/nvss/bridged_race.htm.
Births
1973–1989: National Bureau of Economic Research, NCHS’ vital statistics natality birth data: 1968–2015, http://www.nber.org/data/vital-statistics-natality-data.html.
1990–2011: NCHS, Tables of final births by mother’s age, race and Hispanic ethnicity from the National Vital Statistics System, http://205.207.175.93/VitalStats/ReportFolders/reportFolders.aspx, accessed October 7, 2015.
2013: NCHS, Tables of final births by mother’s age, race and Hispanic ethnicity from the National Vital Statistics System, data obtained by special request.
Abortions
1972: CDC, Abortion Surveillance, Annual Summary 1972, Atlanta: CDC, 1974.
1973–1988: Henshaw SK and Van Vort J, eds., Abortion Factbook, New York: The Alan Guttmacher Institute, 1992, Table 1, p. 172.
1989–2013: Unpublished data based on the national total number of abortions from the Guttmacher Institute’s Abortion Provider Census; Guttmacher estimates for noncensus years (1989, 1990, 1993, 1994, 1997, 1998, 2001, 2002, 2003, 2006, 2009, 2012); and the adjusted age, race and ethnicity distribution of abortions from the CDC.
Sexually experienced women
NCHS, Public use data tape documentation, National Survey of Family Growth (NSFG) Cycle III (1982), Hyattsville, MD: NCHS, 1986.
NCHS, Public use data tape documentation, NSFG Cycle IV (1988), Hyattsville, MD: NCHS, 1990.
NCHS, Public use data file documentation, NSFG Cycle 5 (1995), User’s Guide, Hyattsville, MD: NCHS, 1997.
NCHS, Public use data file documentation, NSFG Cycle 6 (2002), User’s Guide, Hyattsville, MD: NCHS, 2004.
NCHS, Public use data file documentation, 2006–2010 NSFG, User’s Guide, Hyattsville, MD: NCHS, 2011.
NCHS, Public use data file documentation, 2011–2013 NSFG, User’s Guide, Hyattsville, MD: NCHS, 2014.
NCHS, Public use data file documentation, 2013–2015 NSFG, User’s Guide, Hyattsville, MD: NCHS, 2016.
Suggested Citation
Kost K, Maddow-Zimet I and Arpaia A, Pregnancies, Births and Abortions Among Adolescents and Young Women in the United States, 2013: National and State Trends by Age, Race and Ethnicity, New York: Guttmacher Institute, 2017, https://www.guttmacher.org/report/us-adolescent-pregnancy-trends-2013.
Acknowledgments
This report was prepared by Kathryn Kost, Isaac Maddow-Zimet and Alex Arpaia, all of the Guttmacher Institute. It was edited by Chris Olah. Jonathan Bearak, Sheila Desai, Megan Donovan, Lawrence Finer, Stanley Henshaw, Megan Kavanaugh, Laura Lindberg and Rebecca Wind provided valuable comments and suggestions. The Guttmacher Institute gratefully acknowledges the unrestricted funding it receives from many individuals and foundations—including major grants from the William and Flora Hewlett Foundation and the David and Lucile Packard Foundation—which undergirds all of the Institute’s work. Additional support was provided by the Guttmacher Center for Population Research Innovation and Dissemination (NIH grant 5 R24 HD074034).


